
Building a SOC Home Lab 1/3
The purpose of this SOC (Security Operations Center) Analyst Lab was to gain hands-on experience in security monitoring and log analysis. This lab provided a controlled environment to experiment with the Elastic Stack (Elasticsearch, Logstash, and Kibana), enabling me to develop practical skills in collecting, processing, and visualizing security data.
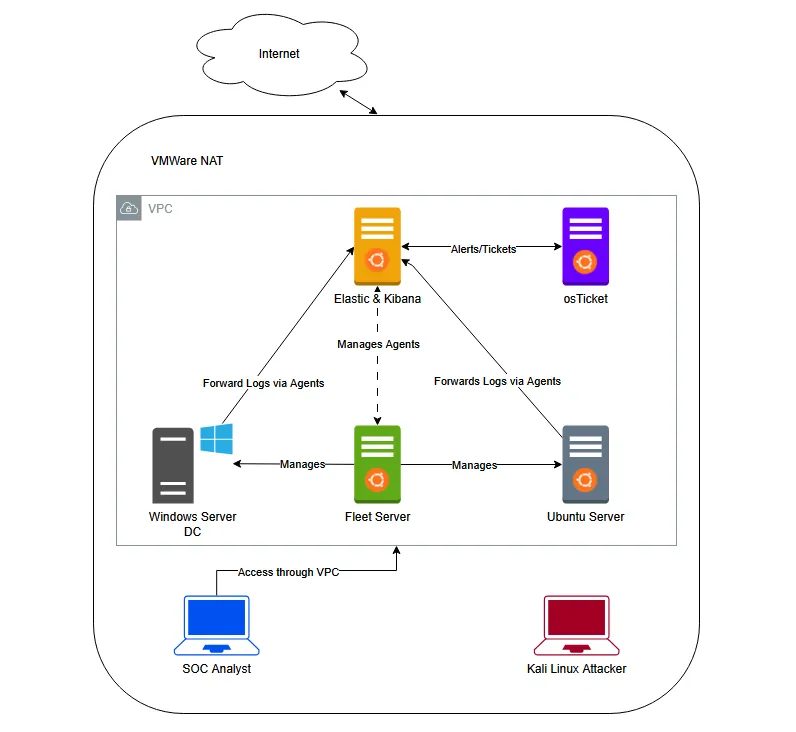
In a real-world production environment, we would implement strict firewall rules and segment components across multiple VPCs to enhance security and control access. However for the sake of simplicity and ease of use, this lab operates within a single unrestricted VPC, allowing seamless communication between all components without additional networking configurations.
Network Structure
- Virtual Private Cloud:
- All components are placed within a single VPC without firewall restrictions to streamline setup and testing.
- This design enables easy interaction between different elements of the Elastic Stack.
- Elastic Stack Components:
- Elasticsearch Server: The core storage and search engine for log data.
- Kibana: A visualization and management interface for analyzing logs, configuring dashboards, and setting up alerts.
- Fleet Server: Manages Elastic Agents, handling log ingestion and configuration updates.
- Log Sources & Agents:
- Windows Server with Elastic Agent: Collects logs from Windows systems, including Sysmon and Windows Defender events.
- Ubuntu Server with Elastic Agent: Gathers Linux system logs, SSH authentication attempts, and syslog events.
- Elastic Agents: Installed on both Windows and Ubuntu servers to forward logs to Elasticsearch.
ElasticSearch
First, we download ElasticSearch and install it on the Ubuntu server:
sudo dpkg -i elasticsearch-8.17.3-amd64.deb
After installation, we take note of the important information ElasticSearch provides!
--------------------------- Security autoconfiguration information ------------------------------

Authentication and authorization are enabled.
TLS for the transport and HTTP layers is enabled and configured.

The generated password for the elastic built-in superuser is : ZfiRLqnfkK=1l8RyvxO0

If this node should join an existing cluster, you can reconfigure this with
'/usr/share/elasticsearch/bin/elasticsearch-reconfigure-node --enrollment-token <token-here>'
after creating an enrollment token on your existing cluster.

You can complete the following actions at any time:

Reset the password of the elastic built-in superuser with
'/usr/share/elasticsearch/bin/elasticsearch-reset-password -u elastic'.

Generate an enrollment token for Kibana instances with
 '/usr/share/elasticsearch/bin/elasticsearch-create-enrollment-token -s kibana'.

Generate an enrollment token for Elasticsearch nodes with
'/usr/share/elasticsearch/bin/elasticsearch-create-enrollment-token -s node'.

-------------------------------------------------------------------------------------------------
### NOT starting on installation, please execute the following statements to configure elasticsearch service to start automatically using systemd
 sudo systemctl daemon-reload
 sudo systemctl enable elasticsearch.service
### You can start elasticsearch service by executing
 sudo systemctl start elasticsearch.service
Next, we need to edit the ElasticSearch configuration file to allow external clients within the same NAT to access ElasticSearch using the machine’s static IP (10.1.1.3).
We open the configuration file:
sudo nano /etc/elasticsearch/elasticsearch.ymlInside, we look for the network.host setting and change it to our static IP, we also uncomment the http.port
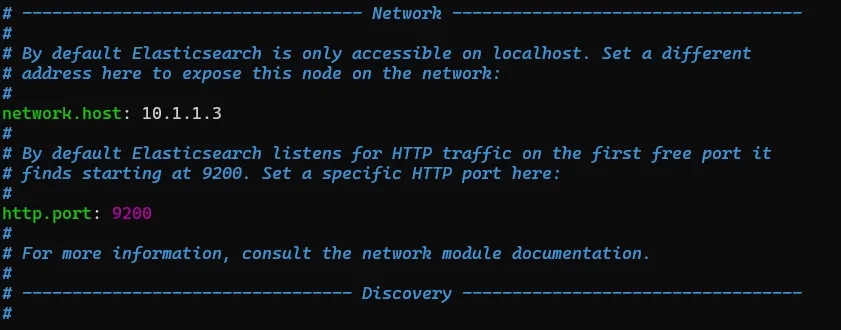
This allows ElasticSearch to listen for connections on this IP instead of just localhost.
Then we enable the service and starts it!
walidpyh@blume-ek01:~$ sudo systemctl daemon-reload
walidpyh@blume-ek01:~$ sudo systemctl enable elasticsearch.service
Created symlink /etc/systemd/system/multi-user.target.wants/elasticsearch.service → /lib/systemd/system/elasticsearch.service.
walidpyh@blume-ek01:~$ sudo systemctl start elasticsearch.service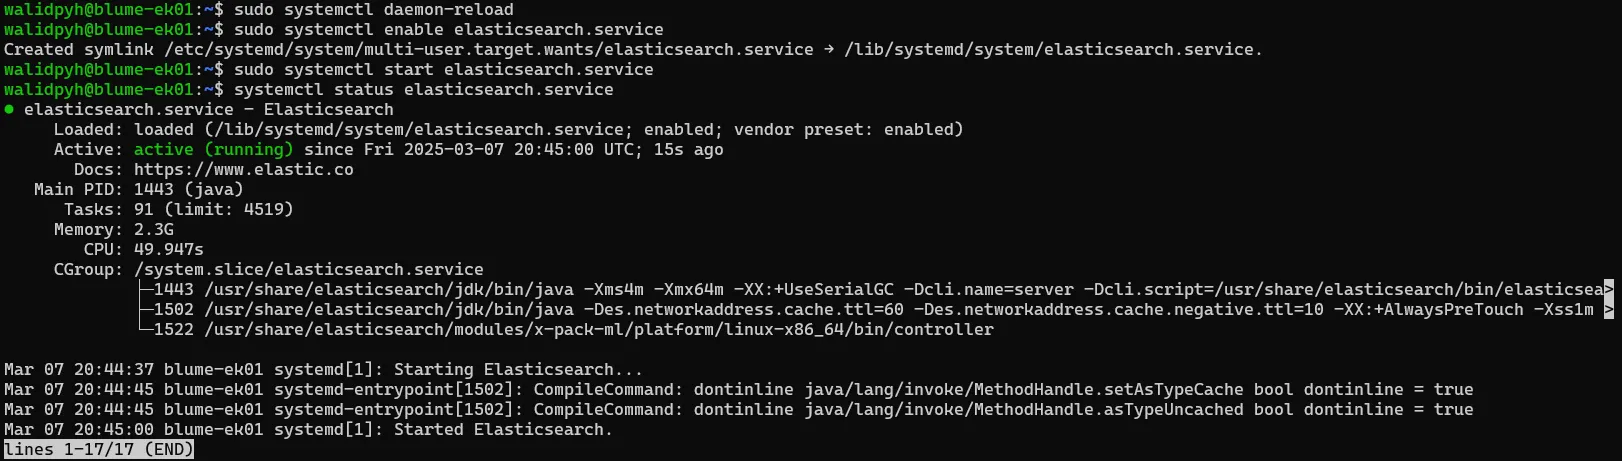
Kibana
Now, let’s proceed with installing Kibana.
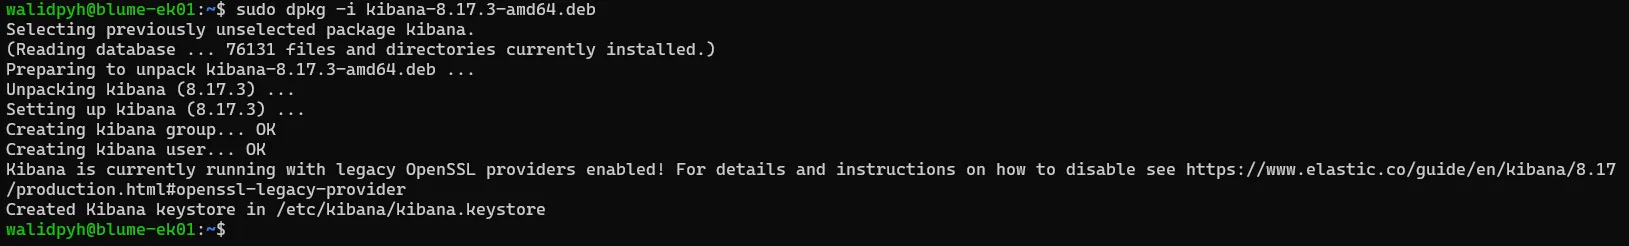
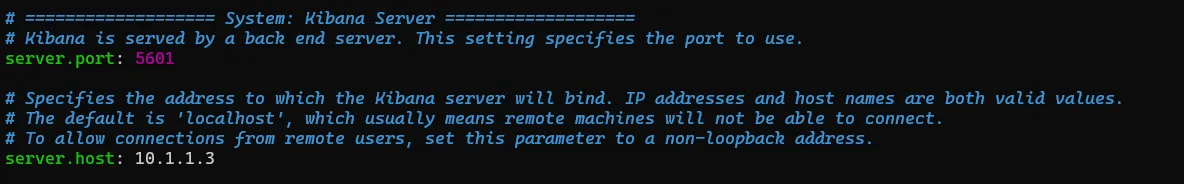
Before we start using Kibana, we need to tweak a configuration file located at /etc/kibana/kibana.yml.
To do this, uncomment both the server host and set the port. Make sure to configure the host with your static IP address.
After that, enable and start the Kibana service with the following commands:
walidpyh@blume-ek01:~$ sudo systemctl daemon-reload
walidpyh@blume-ek01:~$ sudo systemctl enable kibana.service
Created symlink /etc/systemd/system/multi-user.target.wants/kibana.service → /lib/systemd/system/kibana.service.
walidpyh@blume-ek01:~$ sudo systemctl start kibana.service
At this point, before we can access Kibana, we need to generate an Elasticsearch enrollment token. To do this, run the following command sudo /usr/share/elasticsearch/bin/elasticsearch-create-enrollment-token -s kibana
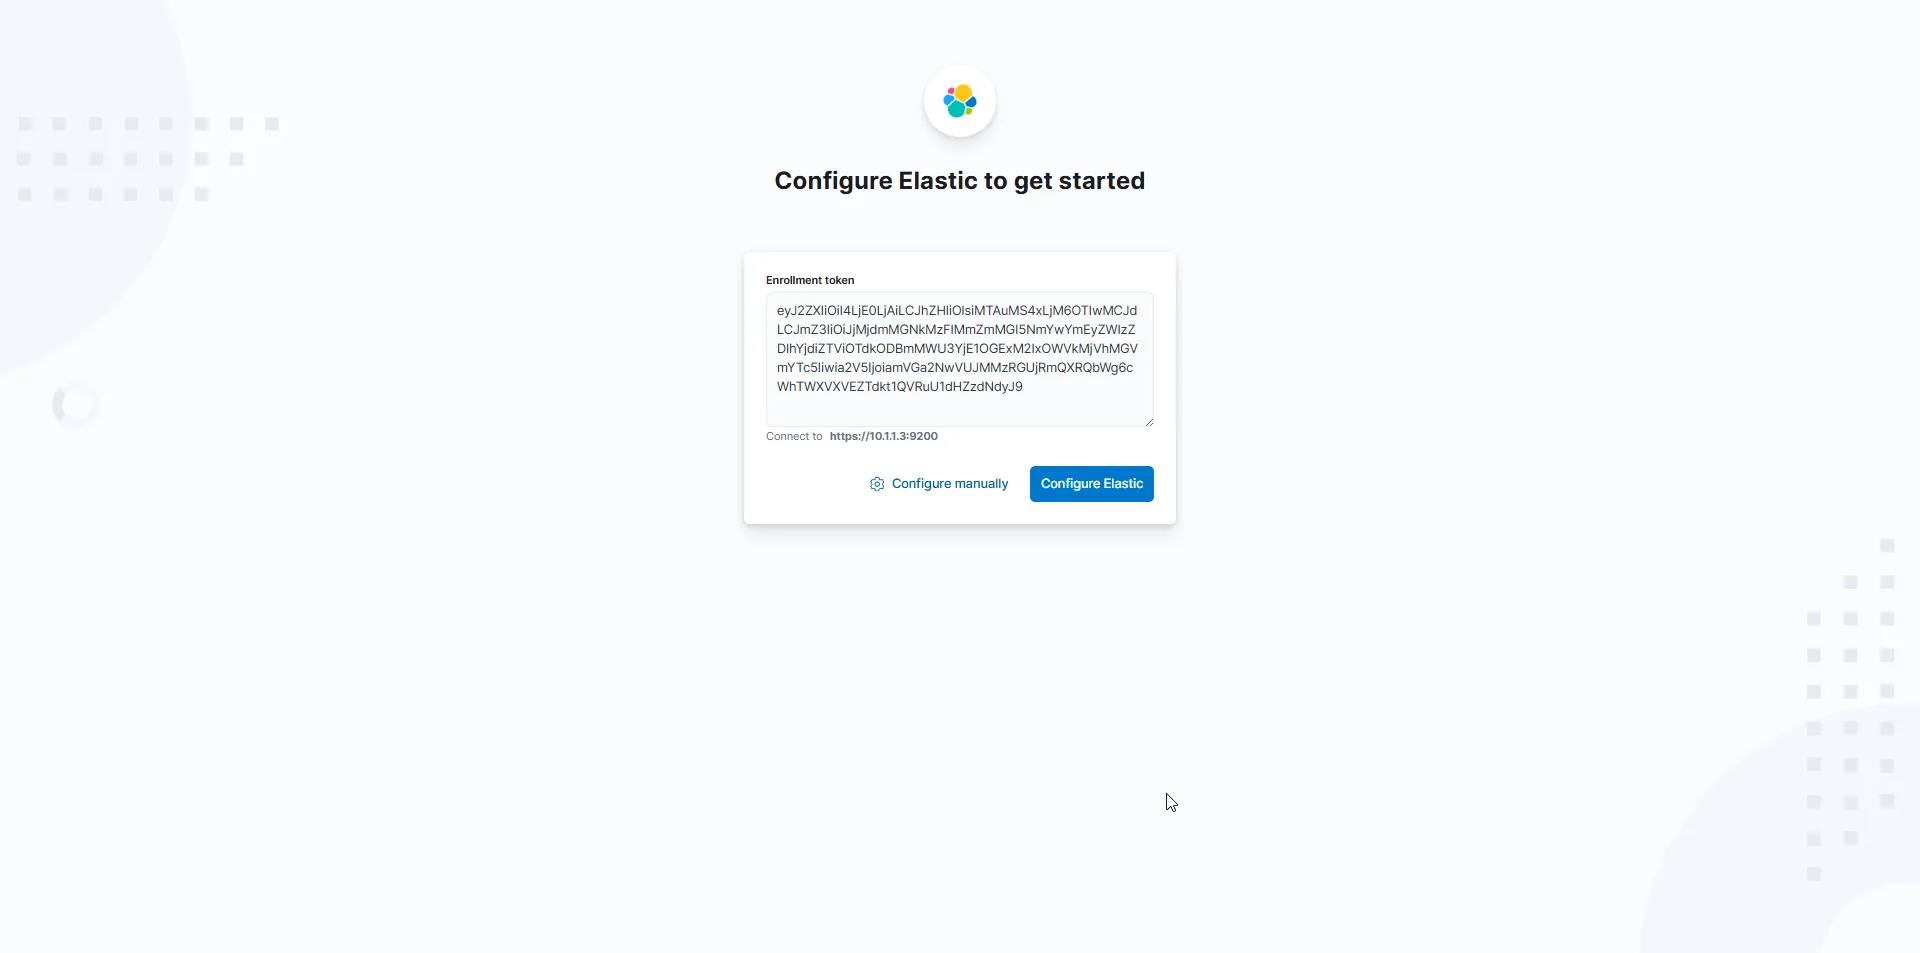
This will output an enrollment token that looks something like this:
enrollment-token -s kibana
eyJ2ZXIiOiI4LjE0LjAiLCJhZHIiOlsiMTAuMS4xLjM6OTIwMCJdLCJmZ3IiOiJjMjdmMGNkMzFlMmZmMGI5NmYwYmEyZWIzZDlhYjdiZTViOTdkODBmMWU3YjE1OGExM2IxOWVkMjVhMGVmYTc5Iiwia2V5IjoiamVGa2NwVUJMMzRGUjRmQXRQbWg6cWhTWXVXVEZTdkt1QVRuU1dHZzdNdyJ9
Now, we’re ready to access Kibana using the token we just generated!
Its asking for a Verification code
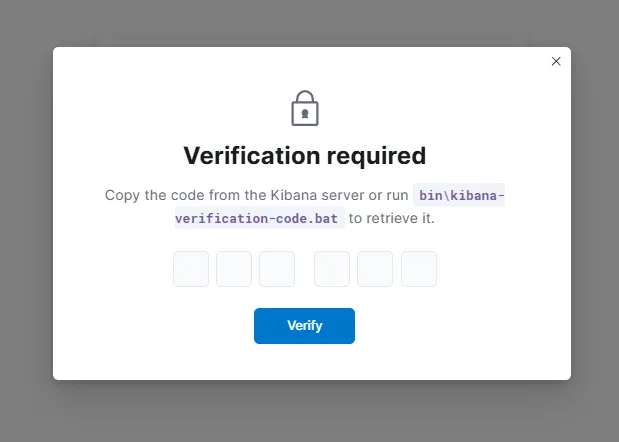
We can easily obtain the it by running: sudo /usr/share/kibana/bin/kibana-verification-code

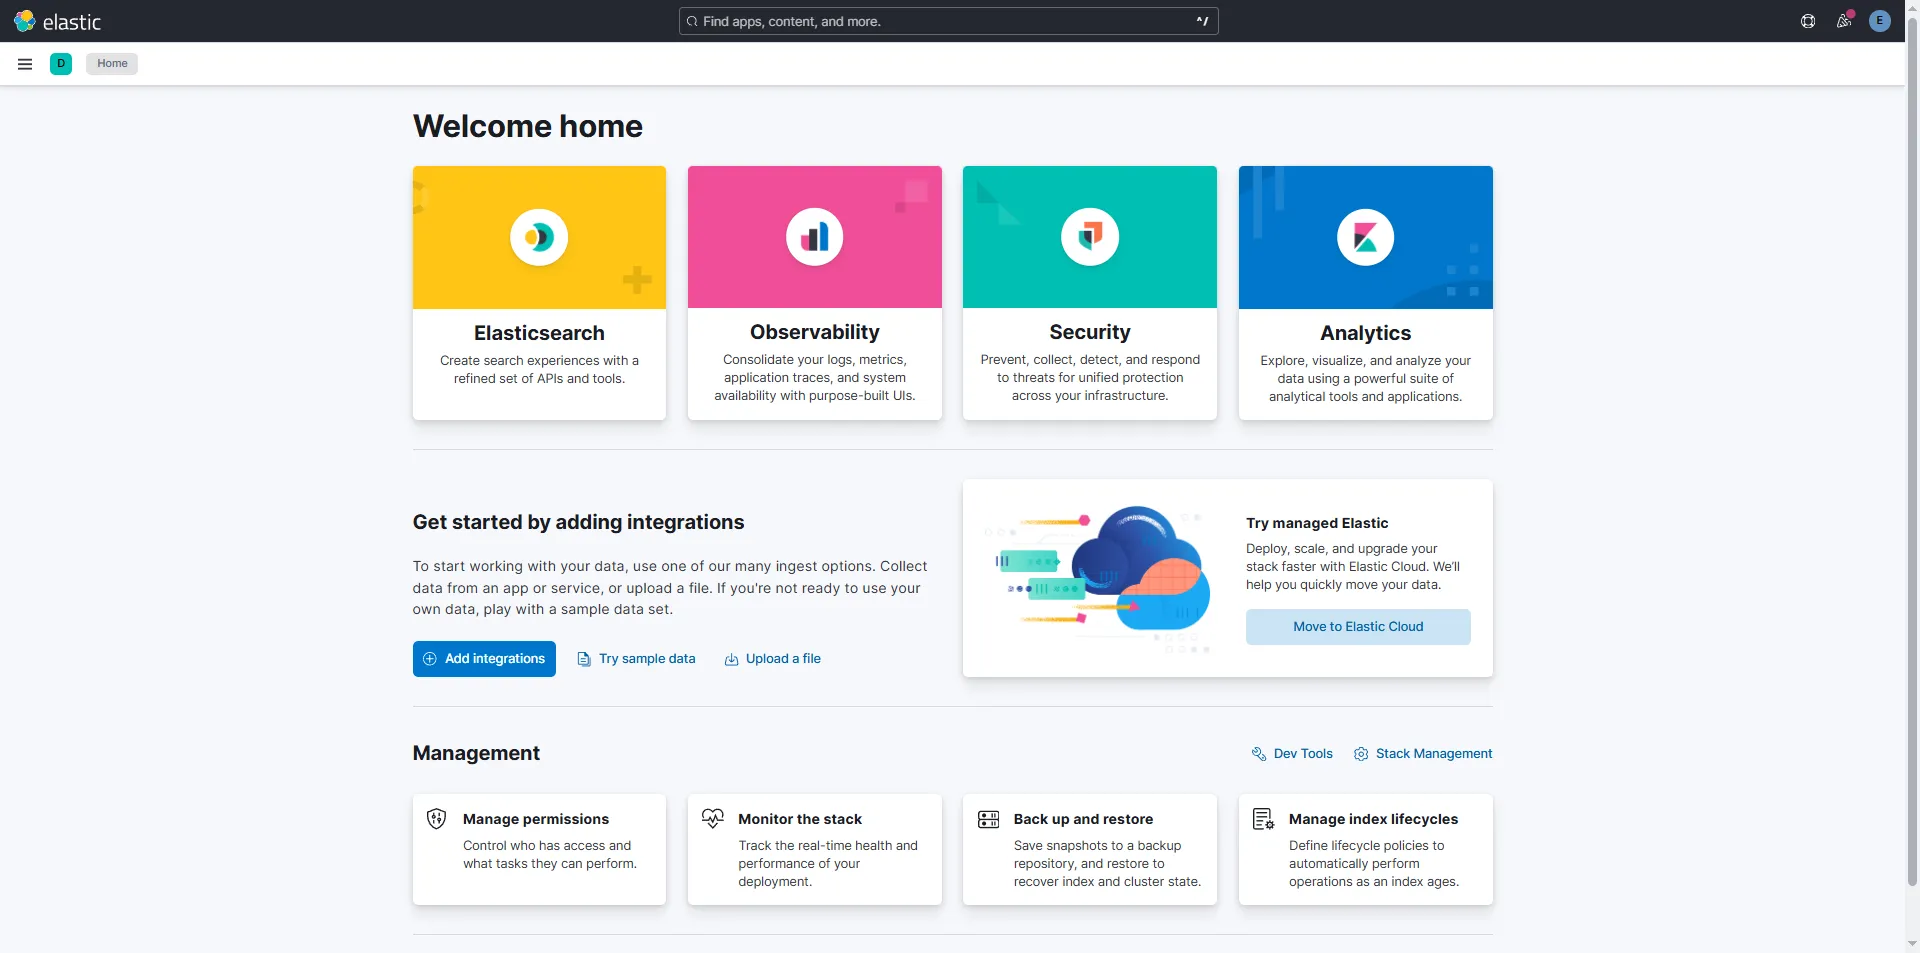
Now, we can access Kibana using the login credentials that Elasticsearch provided us during the installation, which were: elastic:ZfiRLqnfkK=1l8RyvxO0
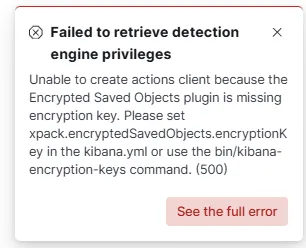
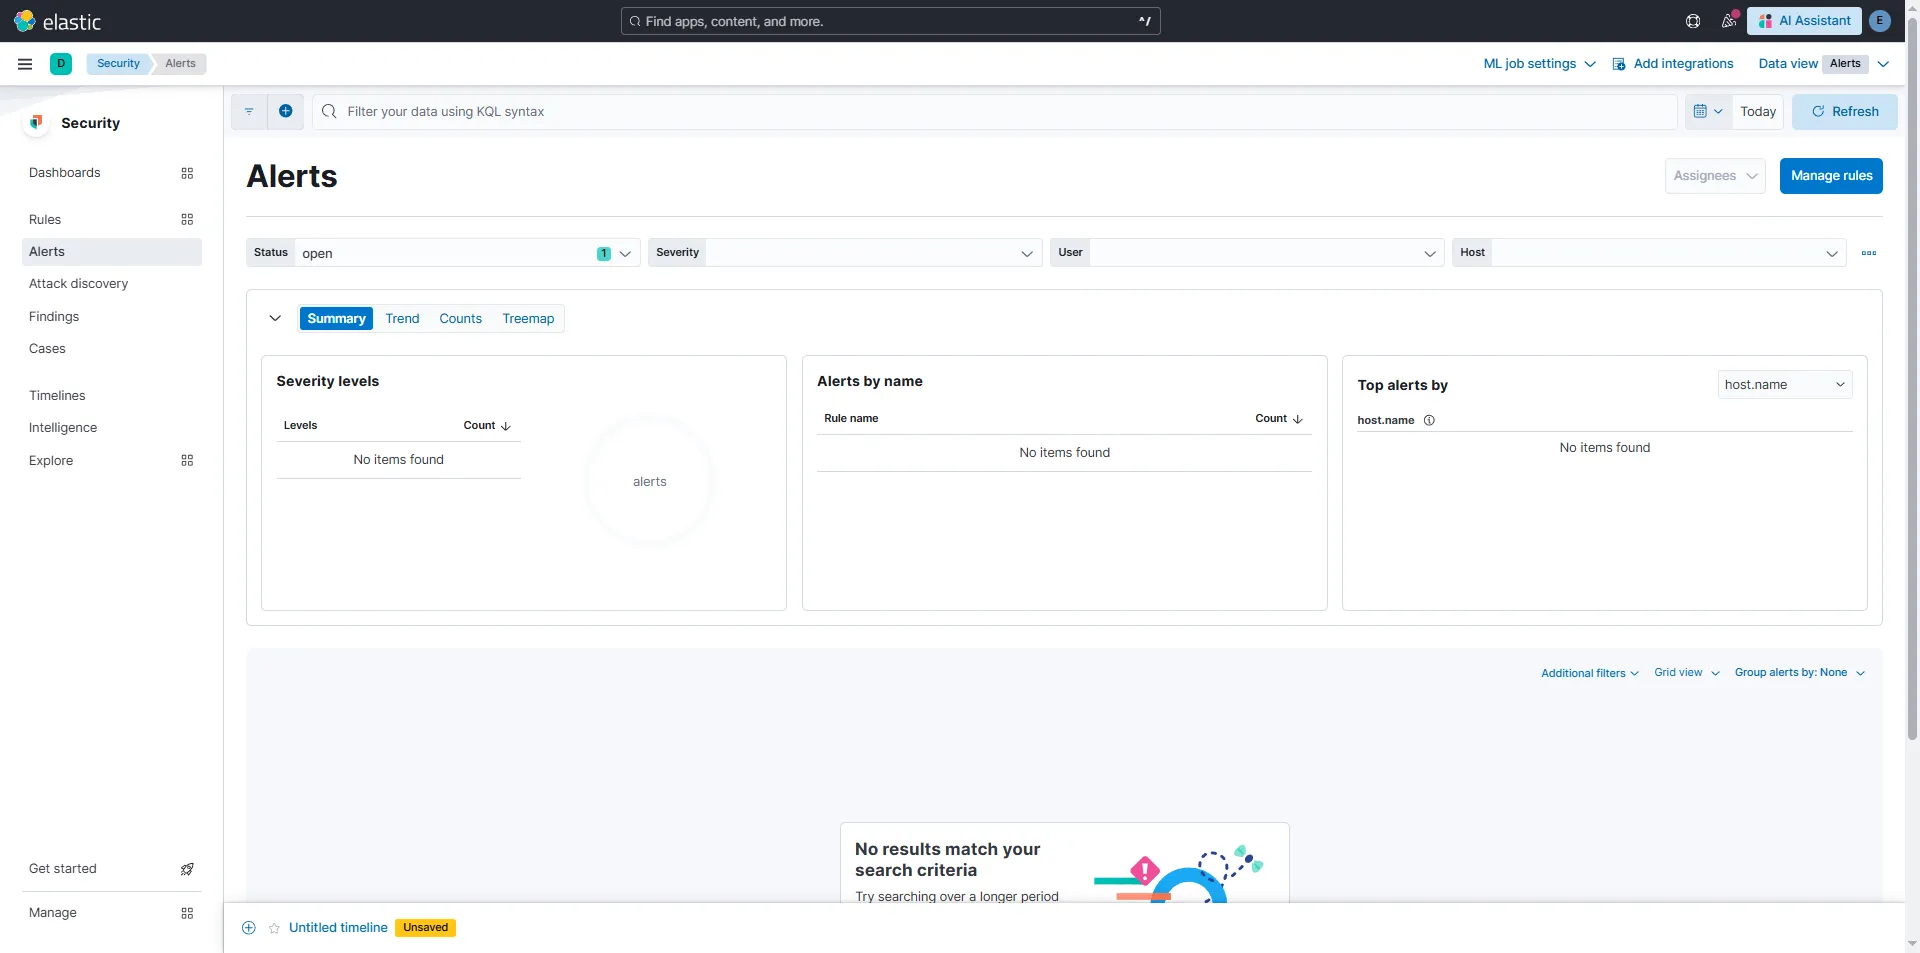
Before we move further in this lab, I’ll quickly set up an encryption key to be used by Kibana. Without this, we’ll get warnings about it, as we can see here in the Security > Alerts section.
To generate the encryption key, run: sudo /usr/share/kibana/bin/kibana-encryption-keys generate
walidpyh@blume-ek01:~$ sudo /usr/share/kibana/bin/kibana-encryption-keys generate
## Kibana Encryption Key Generation Utility

The 'generate' command guides you through the process of setting encryption keys for:

xpack.encryptedSavedObjects.encryptionKey
    Used to encrypt stored objects such as dashboards and visualizations
    https://www.elastic.co/guide/en/kibana/current/xpack-security-secure-saved-objects.html#xpack-security-secure-saved-objects

xpack.reporting.encryptionKey
    Used to encrypt saved reports
    https://www.elastic.co/guide/en/kibana/current/reporting-settings-kb.html#general-reporting-settings

xpack.security.encryptionKey
    Used to encrypt session information
    https://www.elastic.co/guide/en/kibana/current/security-settings-kb.html#security-session-and-cookie-settings

Already defined settings are ignored and can be regenerated using the --force flag.  Check the documentation links for instructions on how to rotate encryption keys.
Definitions should be set in the kibana.yml used configure Kibana.

Settings:
xpack.encryptedSavedObjects.encryptionKey: 9a38bbe1431a1fd4dfda39d6611bc33c
xpack.reporting.encryptionKey: d730a9893b8e9284d72ae19ce1af5fd8
xpack.security.encryptionKey: fb6339a2ec0b6592fea12b329a79500b
Perfect! Now we just need to add these encryptionKeys using /usr/share/kibana/bin/kibana-keystore add
walidpyh@blume-ek01:~$ sudo /usr/share/kibana/bin/kibana-keystore add xpack.encryptedSavedObjects.encryptionKey
Enter value for xpack.encryptedSavedObjects.encryptionKey: ********************************
walidpyh@blume-ek01:~$ sudo /usr/share/kibana/bin/kibana-keystore add xpack.reporting.encryptionKey
Enter value for xpack.reporting.encryptionKey: ********************************
walidpyh@blume-ek01:~$ sudo /usr/share/kibana/bin/kibana-keystore add xpack.security.encryptionKey
Enter value for xpack.security.encryptionKey: ********************************
And restart the service, sudo systemctl restart kibana.service
Fleet Server
Let’s imagine we’ve already installed our agents on around 100 servers. After completing the setup, we log into Kibana, ready to dive into those juicy PowerShell logs we’ve been eagerly awaiting, only to find that we initially forgot to configure the agent to forward them. Dang it!
In this case, you have a couple of options. You can either manually go to each server and machine to reconfigure the agent, or you can use a Group Policy to modify all those Windows endpoints. Alternatively, we can take advantage of a magical component that connects Elastic Agents to a Fleet Server, allowing us to manage all the agents from our centralized server! This is what we’ll be setting up in this section.
But first, let’s answer the question: what is an Elastic Agent?
An Elastic Agent is essentially a service that provides us with a unified way to monitor logs, metrics, and various other types of data. These agents work based on policies that we can configure and update to our preferences. There are two installation methods for an agent:
- Managed by Fleet: The Elastic Agent policies and lifecycle are centrally managed by the Fleet app in Kibana. The Integrations app also lets you centrally add integrations with other popular services and systems. This is the recommended option for most users.
- Standalone Mode: All policies are applied to the Elastic Agent manually through a YAML file. This is intended for more advanced users. See Install standalone Elastic Agents for more information.
But let’s not forget about Beats!
Beats are lightweight data shippers that send operational data to Elasticsearch. Elastic provides separate Beats for different types of data, such as logs, metrics, and uptime. Depending on the data you want to collect, you might need to install multiple shippers on a single host.
In this case, we won’t be using them, since their use case is more specific. While Beats can be useful in certain scenarios, for this setup, an Elastic Agent will suffice because we want to collect everything. Using Beats in this case would be inconvenient, as it would require setting up multiple shippers, whereas an agent handles it all.
Here’s a table showing the differences between Beats and Elastic Agents, just in case anyone is curious:
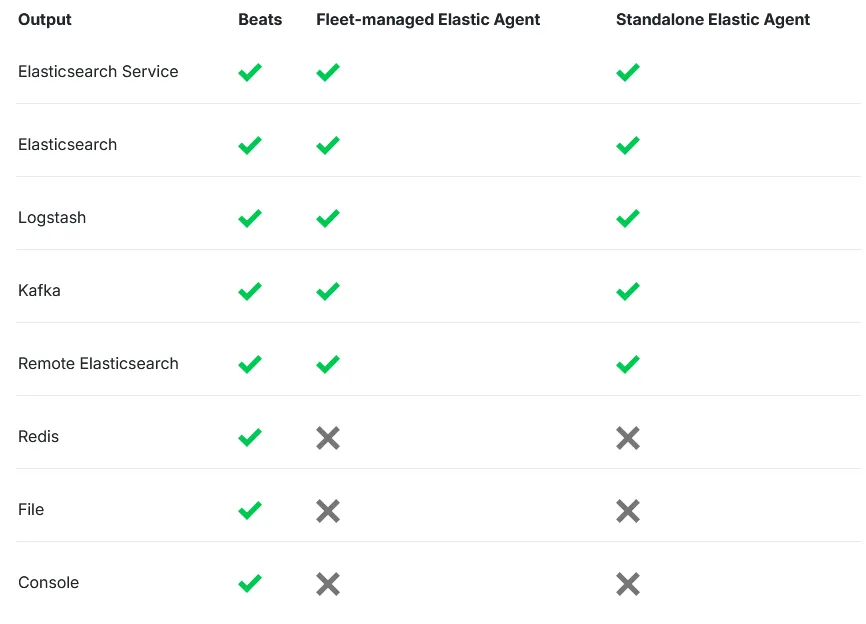
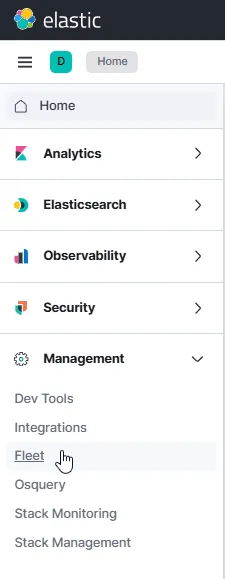
Ok, back to the Fleet setup. To begin, we need to go to the Elastic Dashboard>Management>Fleet
Next, click on Add Fleet Server.
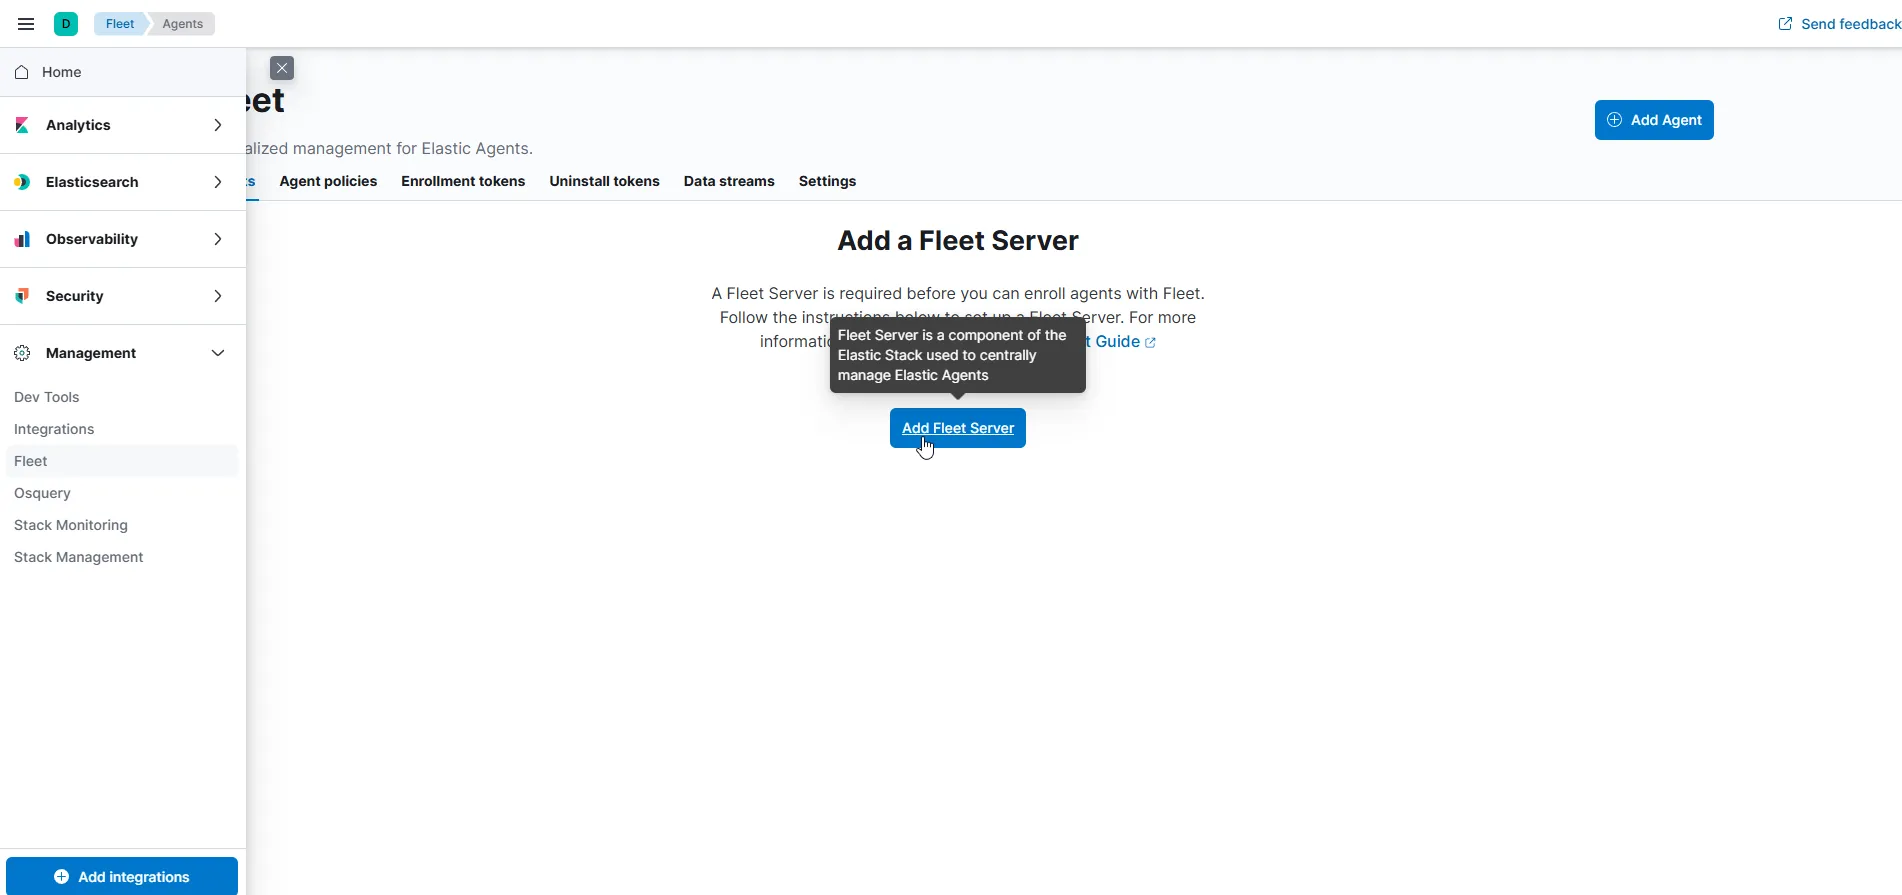
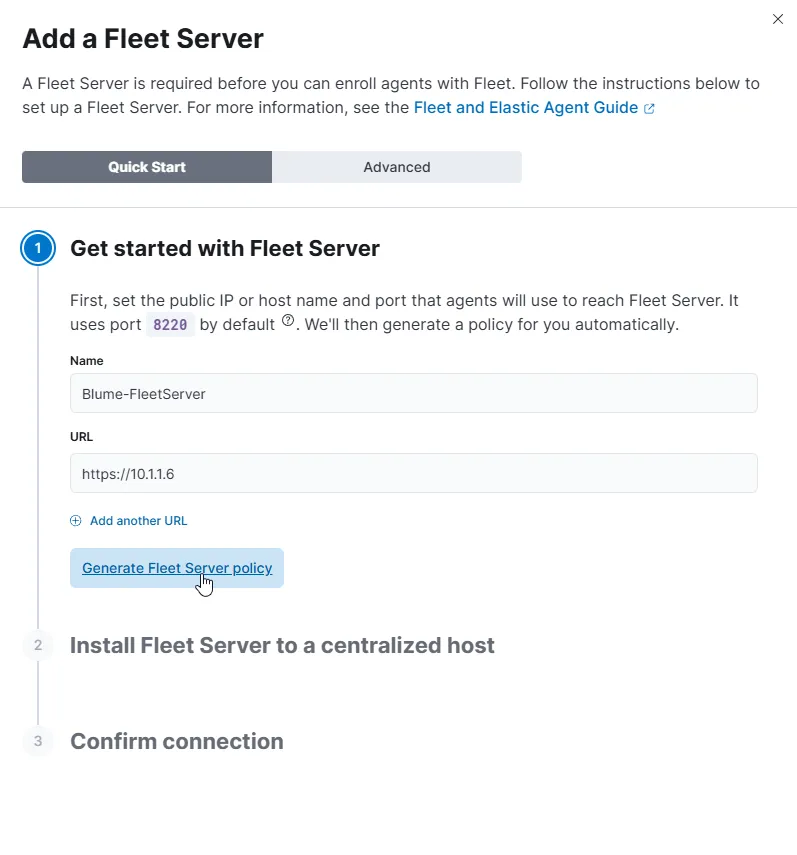
In this case, we’ll go with the Quick Start option, but I’d recommend choosing the Advanced option for production environments. For now, let’s just give it a name and set the URL to the Fleet server’s IP address. Note that, by default, it will be using port 8220. Once that’s done, click Generate Fleet Server Policy.
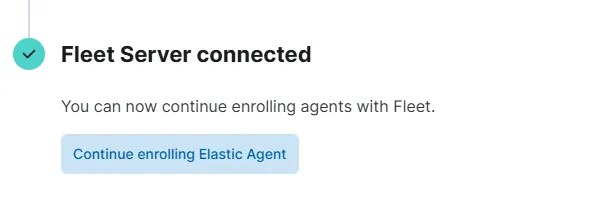
After a few seconds, we’ll get a confirmation with the Fleet Server details, including the host and installation instructions.
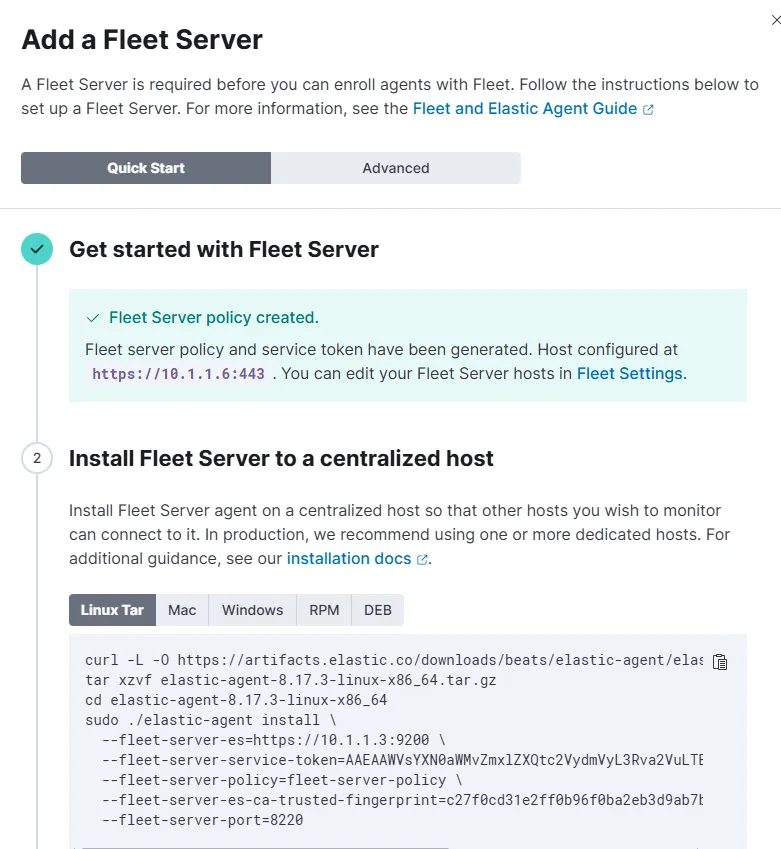
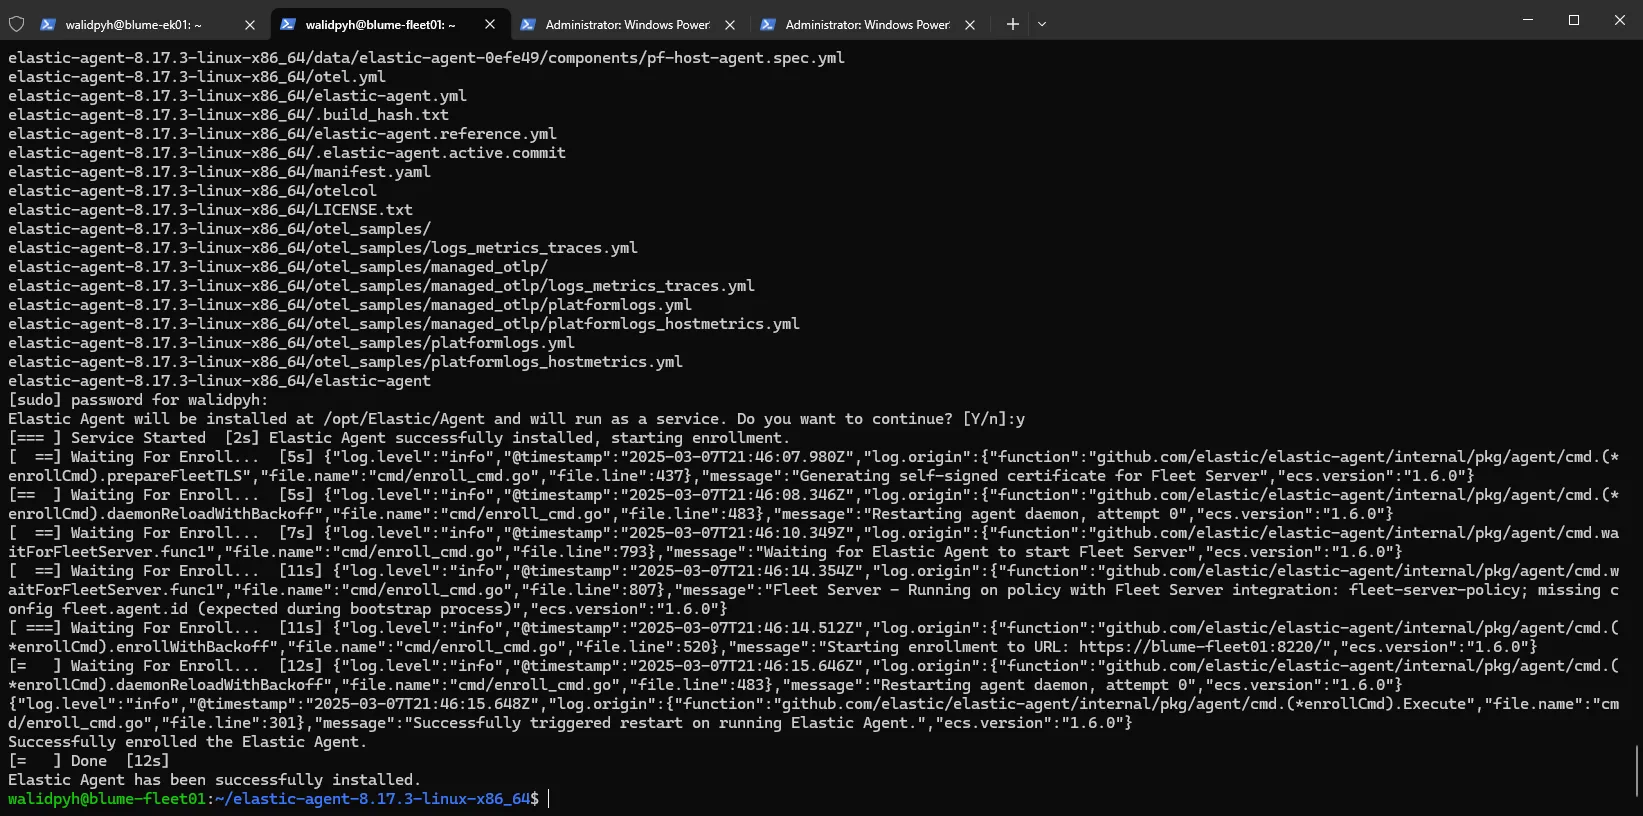
Now, just run those commands on the Fleet Ubuntu server, and it will successfully enroll.
Windows Agent
Next, we continue with the Elastic Agent process. First, we create a new Windows policy.
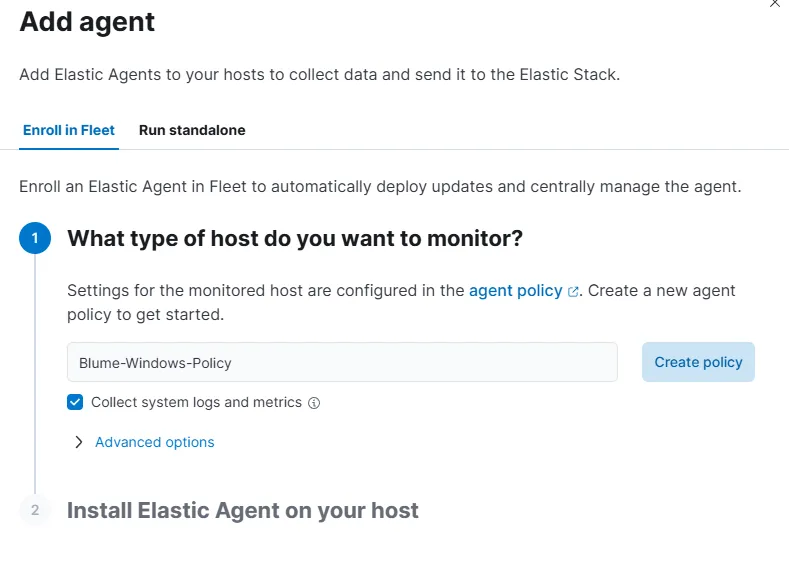
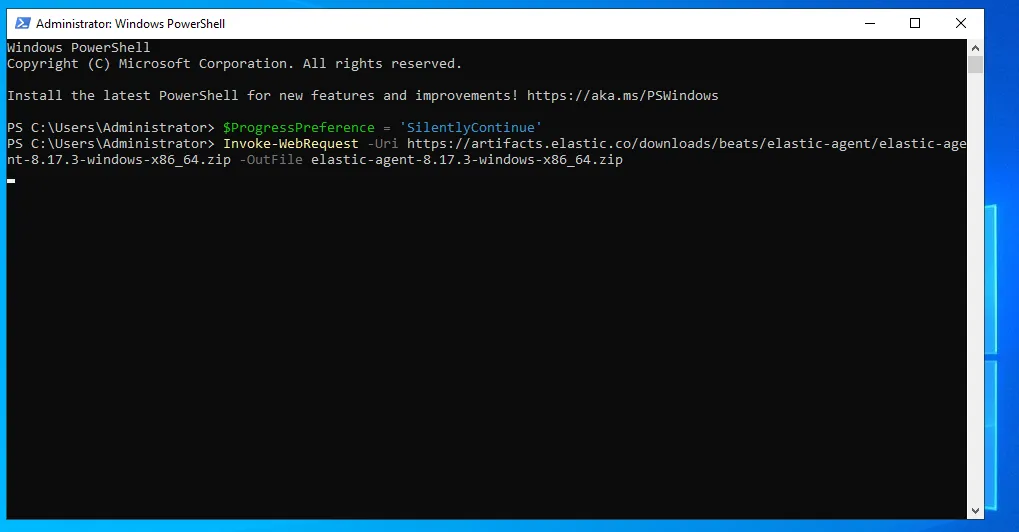
Great! Now we can simply copy the agent download command for the OS we’re working with. In this case, I’ll start with my Windows Server, so I’ll copy the PowerShell command and run it there.
However, before running the command, we need to return to our Fleet settings and change the default port 443 to 8220 (the one we created for our Fleet server) to ensure everything works correctly. We’ll also need to update the PowerShell command to reflect this change and add --insecure to bypass the generated certificate errors.

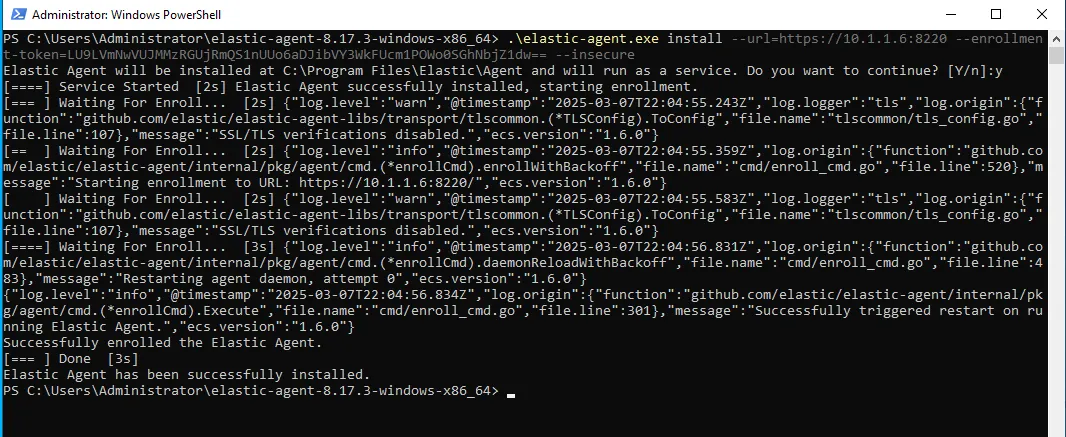
Now that our Windows server has been added and the agent is running as a service, if we go to the Discover section in our Elastic Dashboard, we should start seeing logs there!
Sysmon
Even though we’re now receiving logs from the Windows agent, they don’t track important events like process creation. This is because the default logging configuration isn’t set up to capture those events. We have two options: we can either reconfigure the auditing settings to enable these events, or we can simply install Sysmon!
Sysmon (System Monitor) can monitor a wide range of events such as process creation, network connections, file operations, and more. It’s highly customizable and extremely useful. For more details about Sysmon and its event IDs, check out the official documentation.
We’ll also be using the Olaf Sysmon configuration, which can be found here.
Put this configuration file in the same folder as Sysmon, then open PowerShell and run the following command:
PS C:\Users\Administrator\Downloads\Sysmon> dir
Directory: C:\Users\Administrator\Downloads\Sysmon
Mode LastWriteTime Length Name
---- ------------- ------ ----
-a---- 3/7/2025 3:18 PM 7490 Eula.txt
-a---- 3/7/2025 3:18 PM 8480560 Sysmon.exe
-a---- 3/7/2025 3:18 PM 4563248 Sysmon64.exe
-a---- 3/7/2025 3:18 PM 4993440 Sysmon64a.exe
-a---- 3/7/2025 10:23 PM 253169 sysmonconfig.xml
PS C:\Users\Administrator\Downloads\Sysmon> .\Sysmon64.exe -c sysmonconfig.xml
System Monitor v15.15 - System activity monitor
By Mark Russinovich and Thomas Garnier
Copyright (C) 2014-2024 Microsoft Corporation
Using libxml2. libxml2 is Copyright (C) 1998-2012 Daniel Veillard. All Rights Reserved.
Sysinternals - www.sysinternals.com
Loading configuration file with schema version 4.90
Configuration file validated.
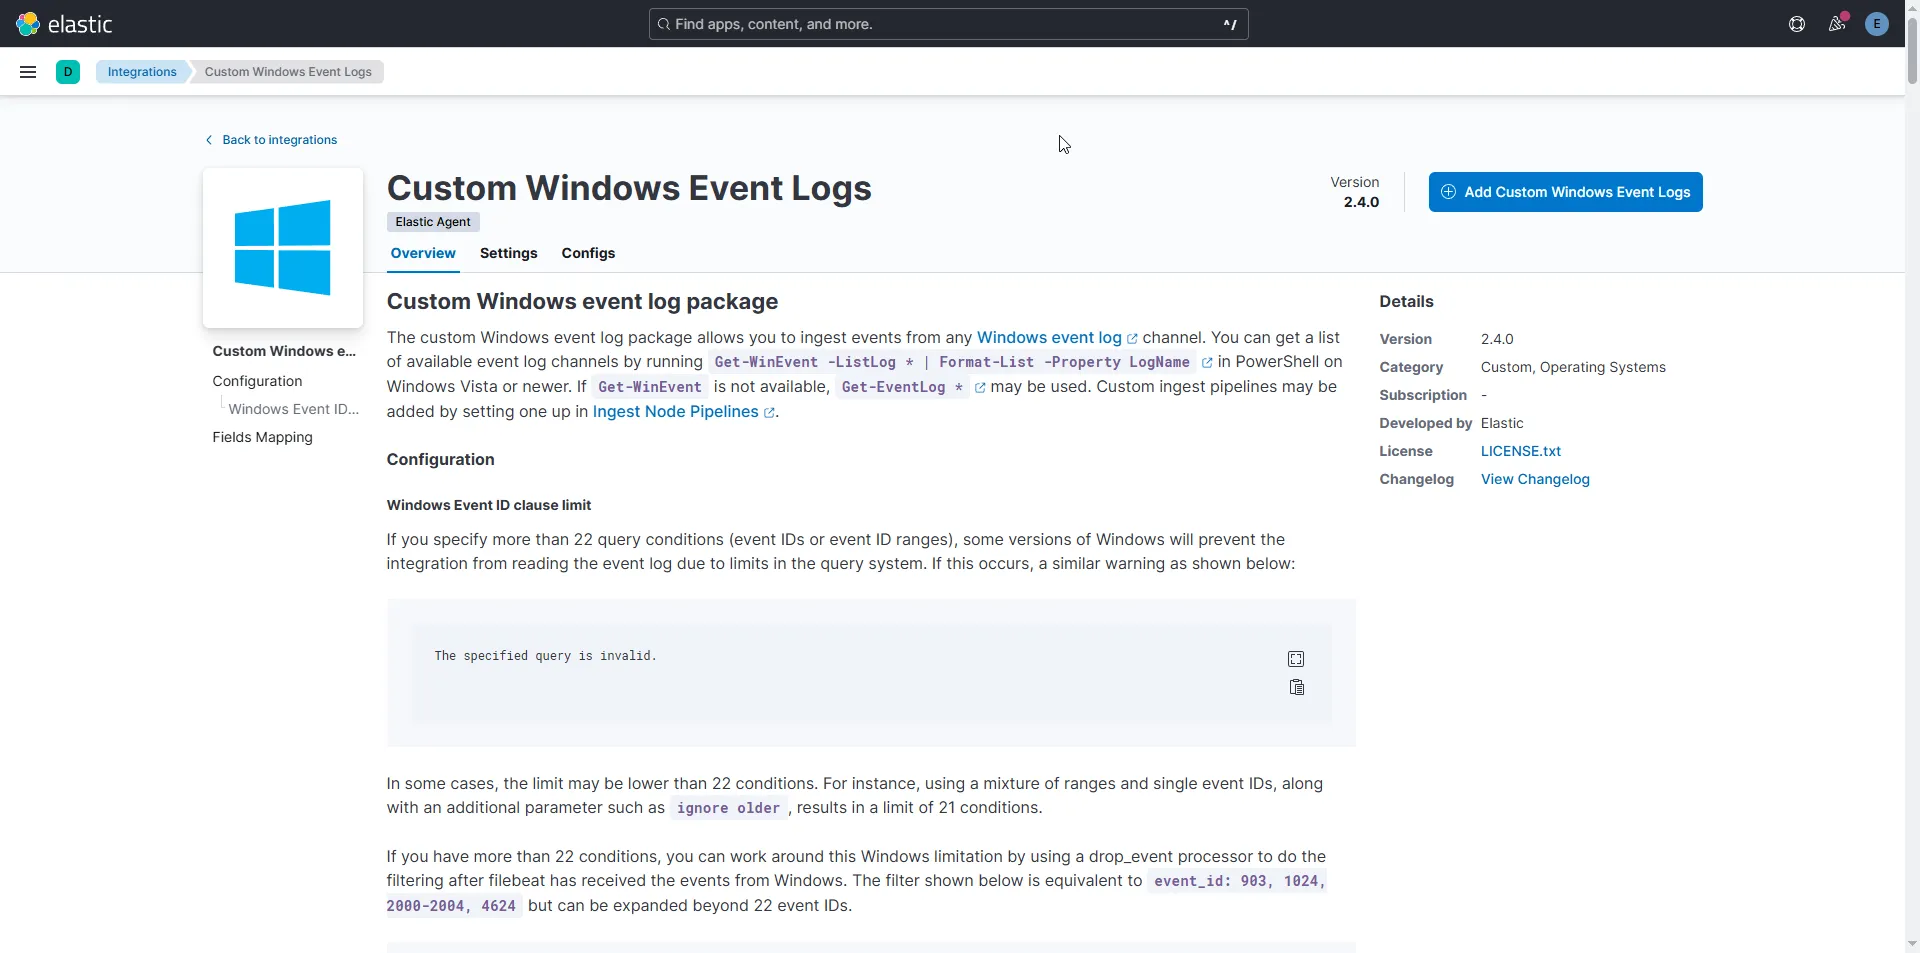
Configuration updated.Now, we need to add the Sysmon integration in Elastic.
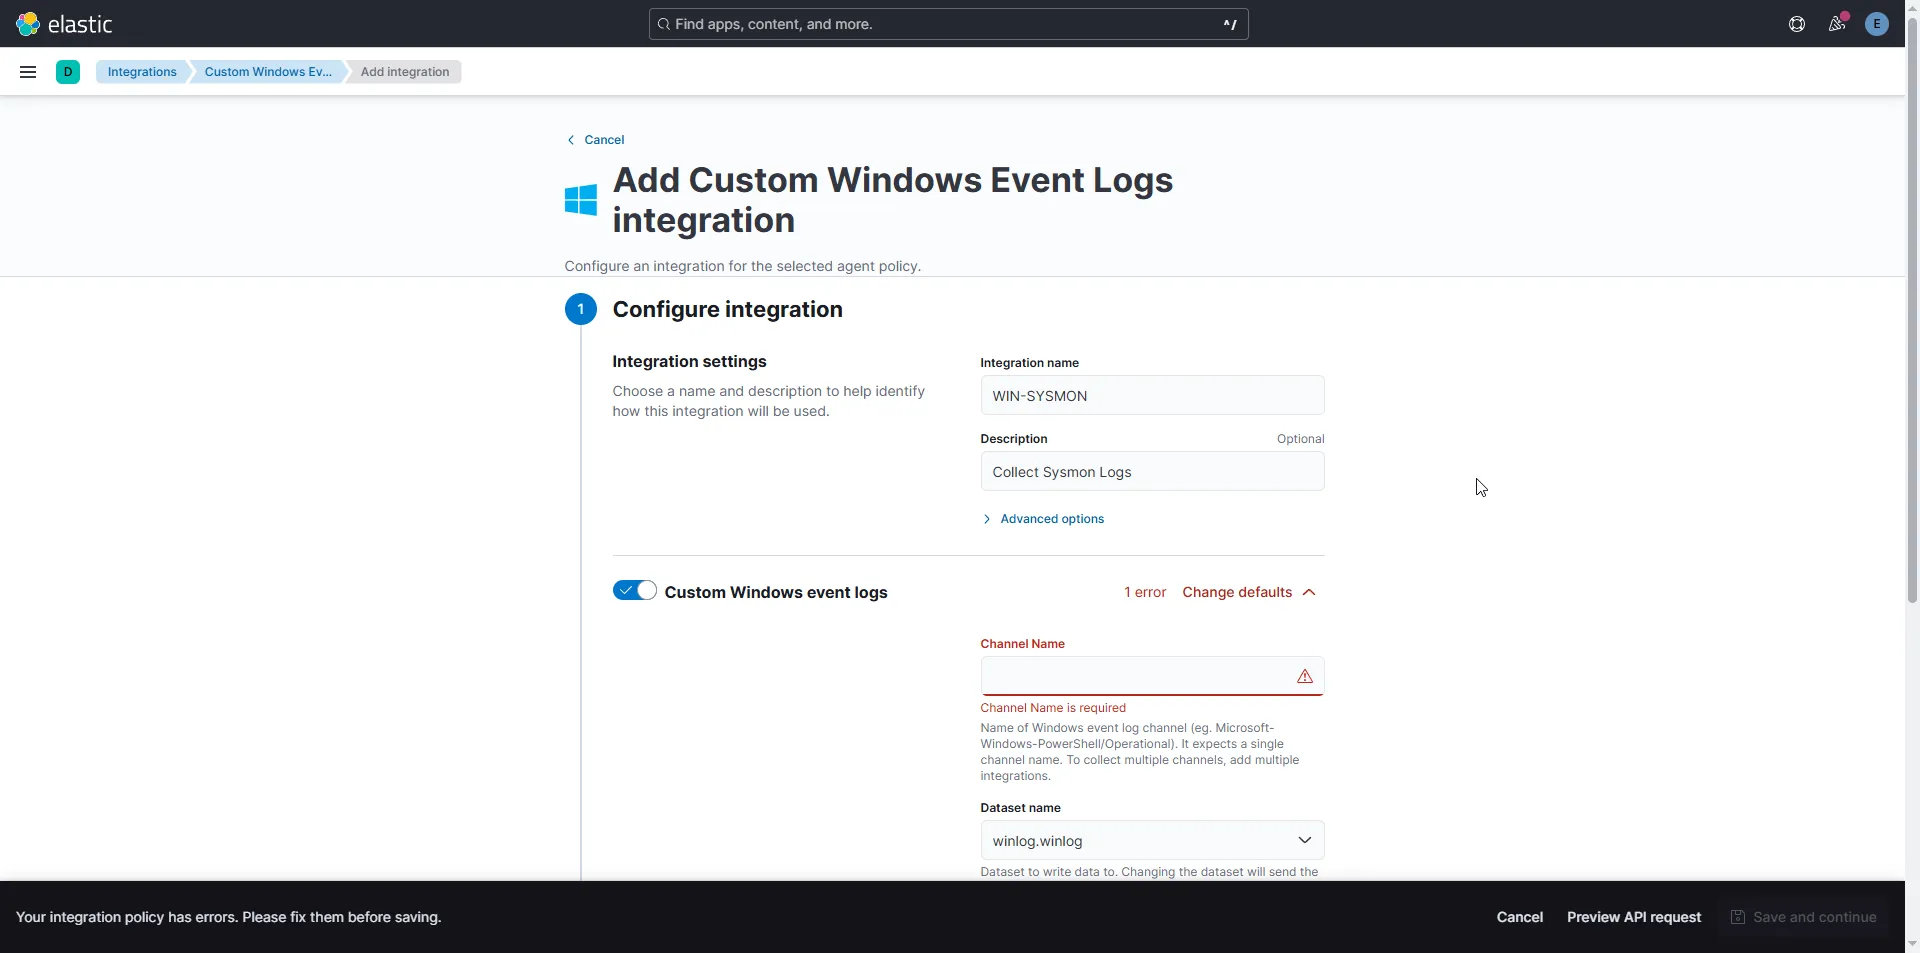
We can do this by adding the Custom Windows Event Logs integration.
After selecting this option, it will ask us for a channel name.
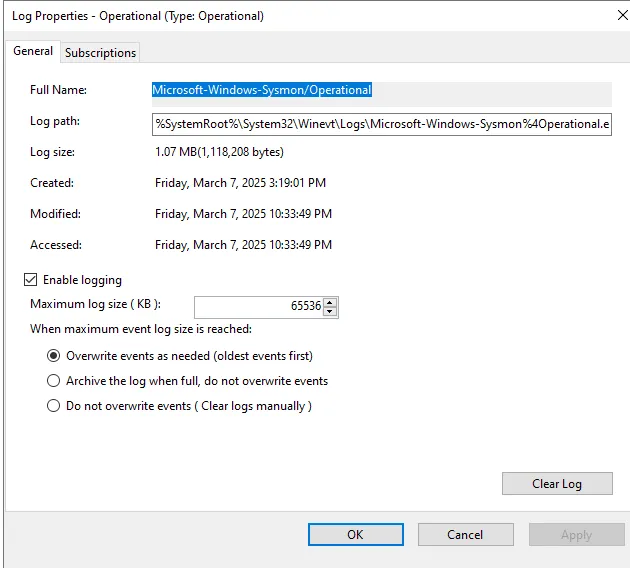
To find the channel name, open Event Viewer, then navigate to > Application and Services Logs > Microsoft > Windows > Sysmon. Right-click Operational, access its properties, and copy the Full Name—this will be the channel name.
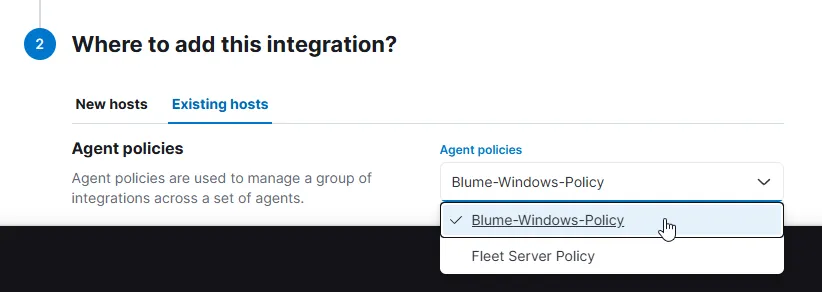
Next, for the Agent Policy, choose to add it to Existing hosts and select the one we created for the Windows machines.
Now, let’s do the same for collecting Defender Logs. Add a new Custom Log, name it WIN-Defender, and for the channel name, choose Operational again!
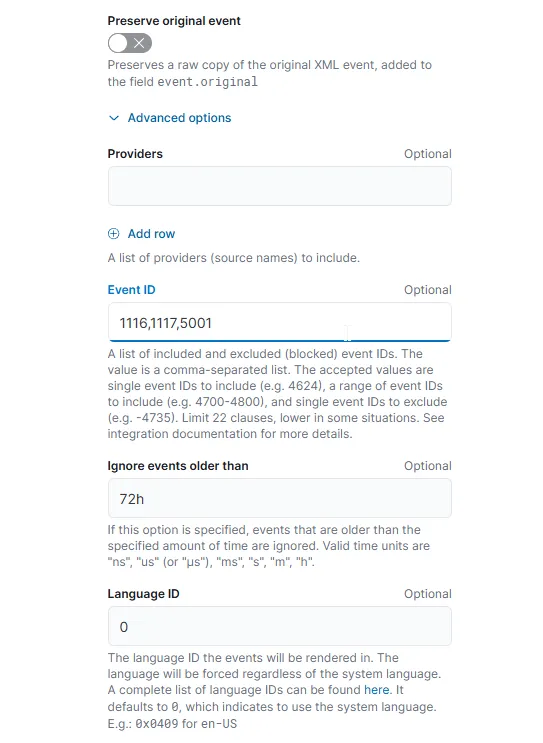
However, there’s one issue: Defender can be quite spammy with many events we don’t really need, like health reports, stats, and other informational events. So, we’ll only focus on the following critical ones:
- Event ID 1116
- Symbolic name:
MALWAREPROTECTION_STATE_MALWARE_DETECTED - Message: The antimalware platform detected malware or other potentially unwanted software.
- Description: Microsoft Defender Antivirus detected malware or other potentially unwanted software.
- Symbolic name:
- Event ID 1117
- Symbolic name:
MALWAREPROTECTION_STATE_MALWARE_ACTION_TAKEN - Message: The antimalware platform performed an action to protect your system from malware or other potentially unwanted software.
- Description: Microsoft Defender Antivirus took action to protect this machine from malware or other potentially unwanted software.
- Symbolic name:
- Event ID 5001
- Symbolic name:
MALWAREPROTECTION_RTP_DISABLED - Message: Real-time protection is disabled.
- Description: Microsoft Defender Antivirus real-time protection scanning for malware and other potentially unwanted software was disabled.
- Symbolic name:
To filter these events, we need to click on Advanced and include the Event IDs as shown above.
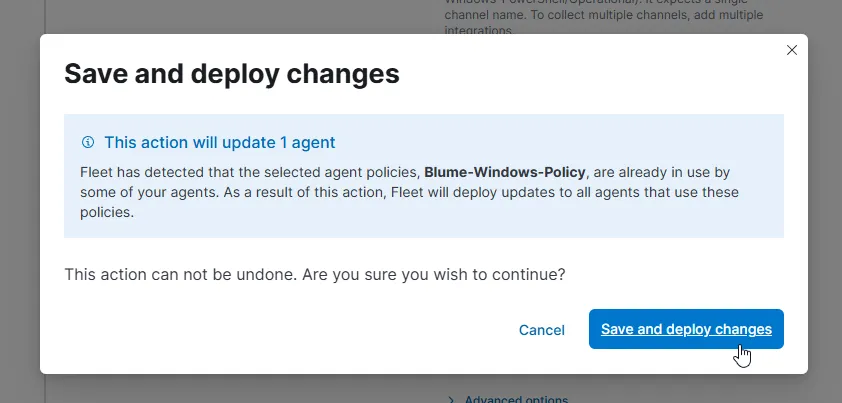
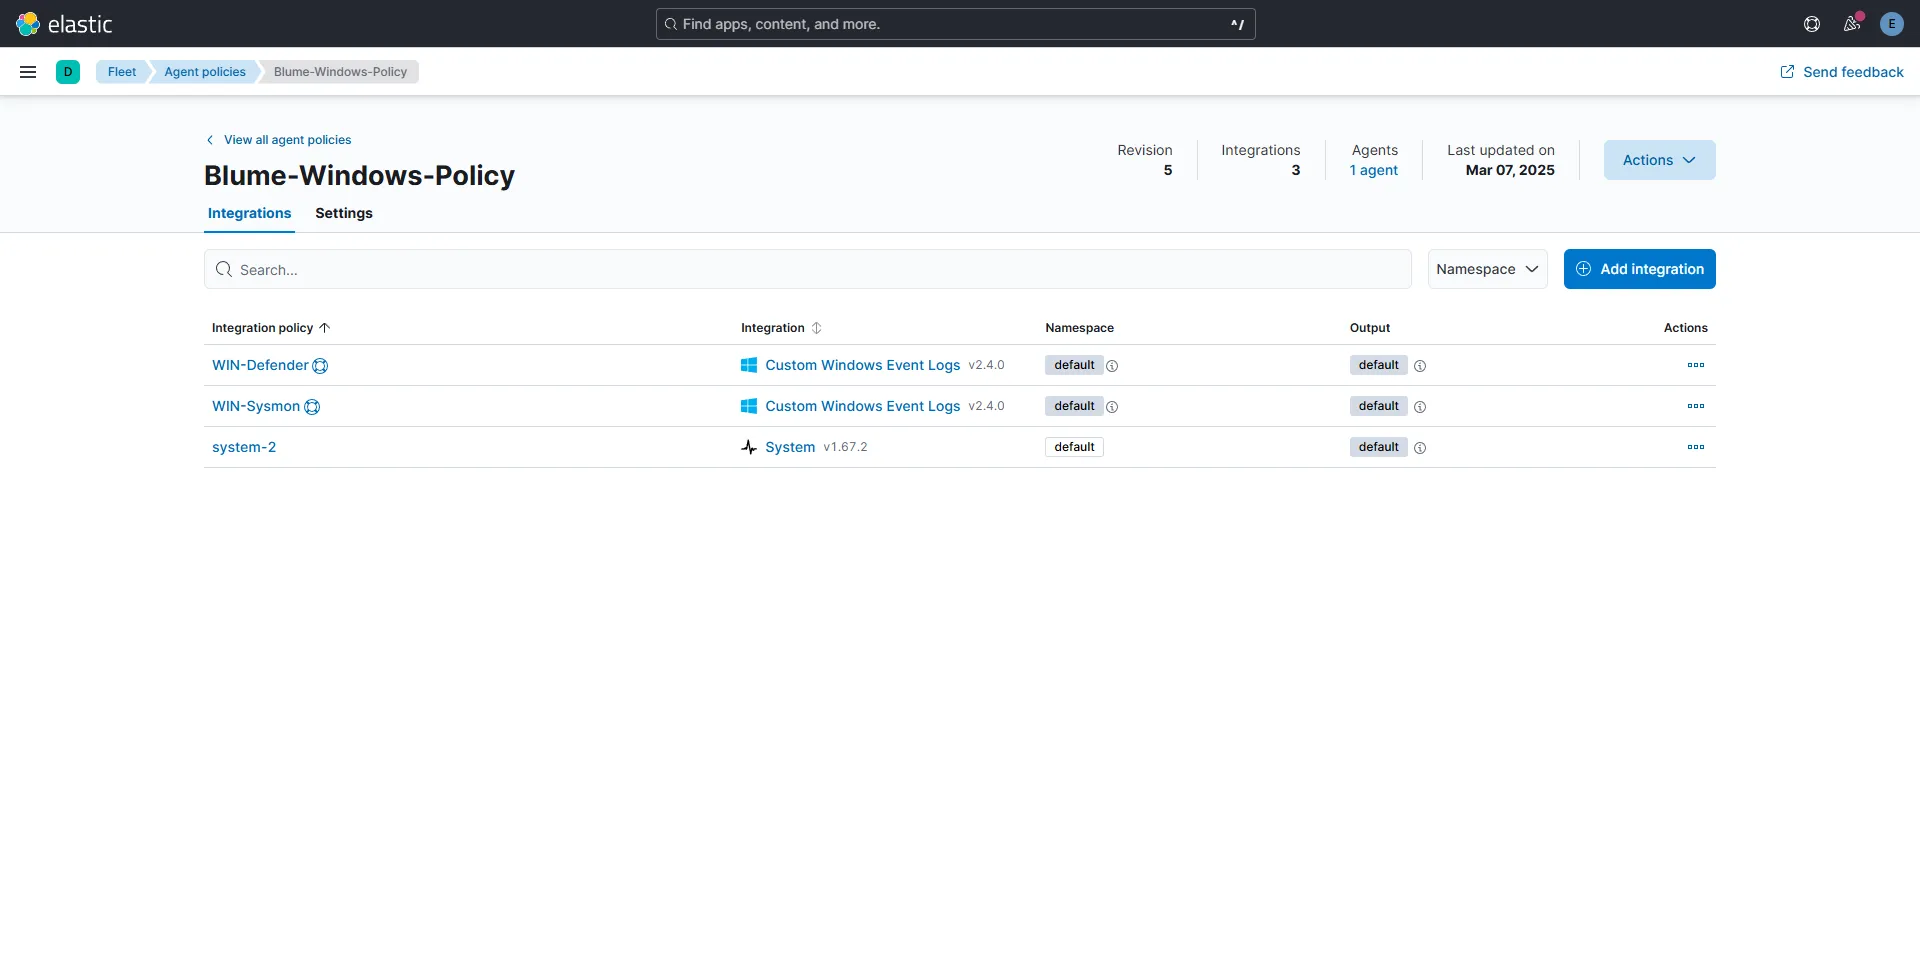
As we did with Sysmon, deploy it to Existing Hosts and then to the Windows policies. Now we should have both Sysmon and Windows Defender events added to our event ingestion pipeline, forwarded from the agent.
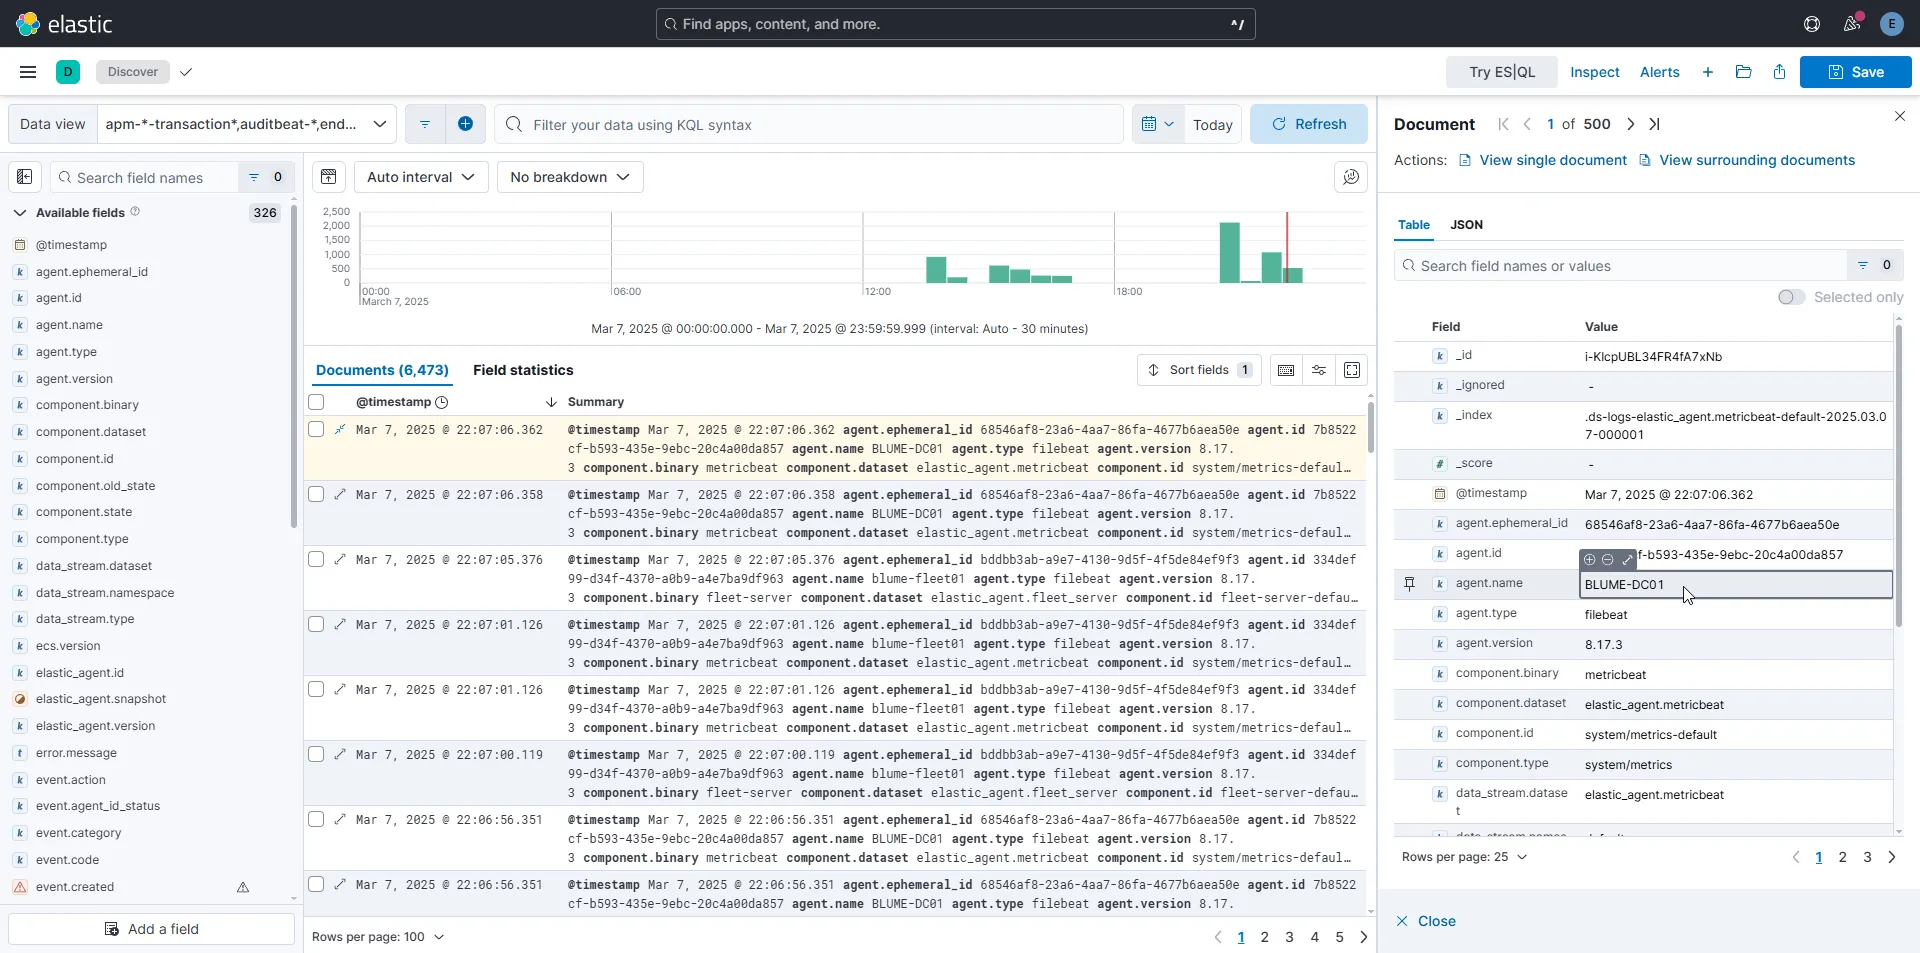
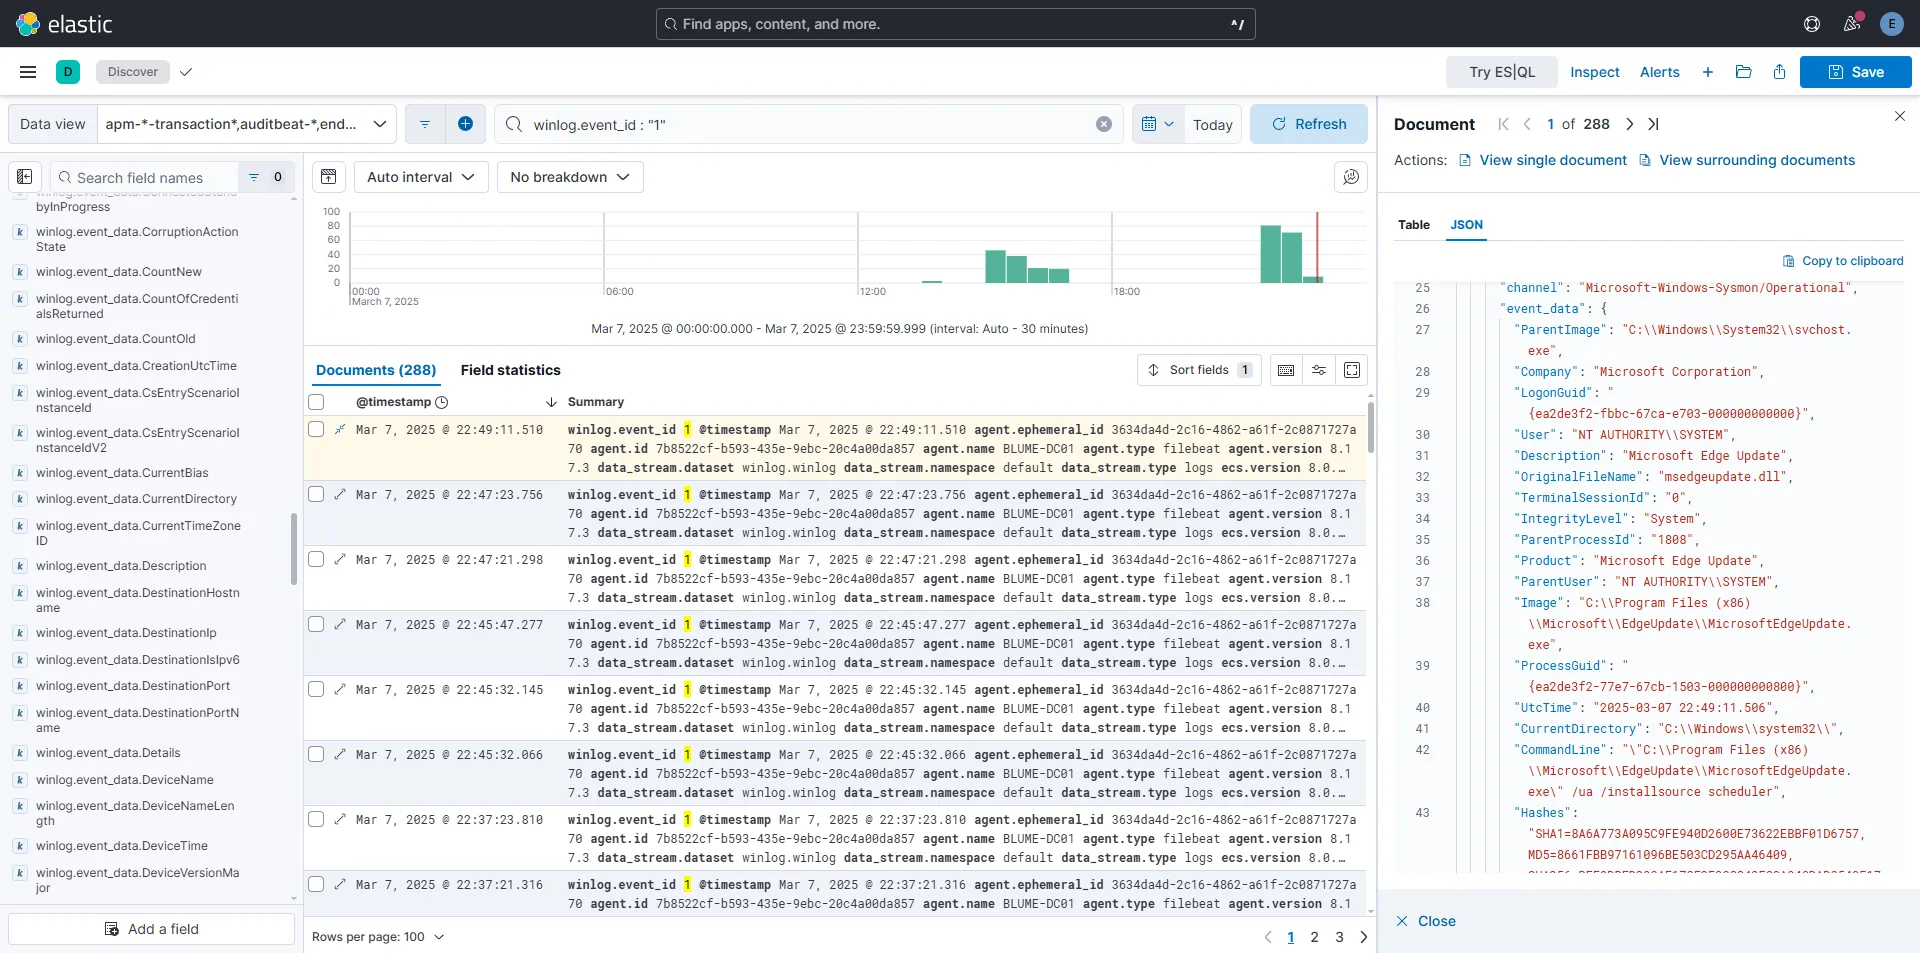
Now, if we go back to Discover and filter by winlog.event_id: "1", which corresponds to ProcessCreate in Sysmon, we’ll get the following results:
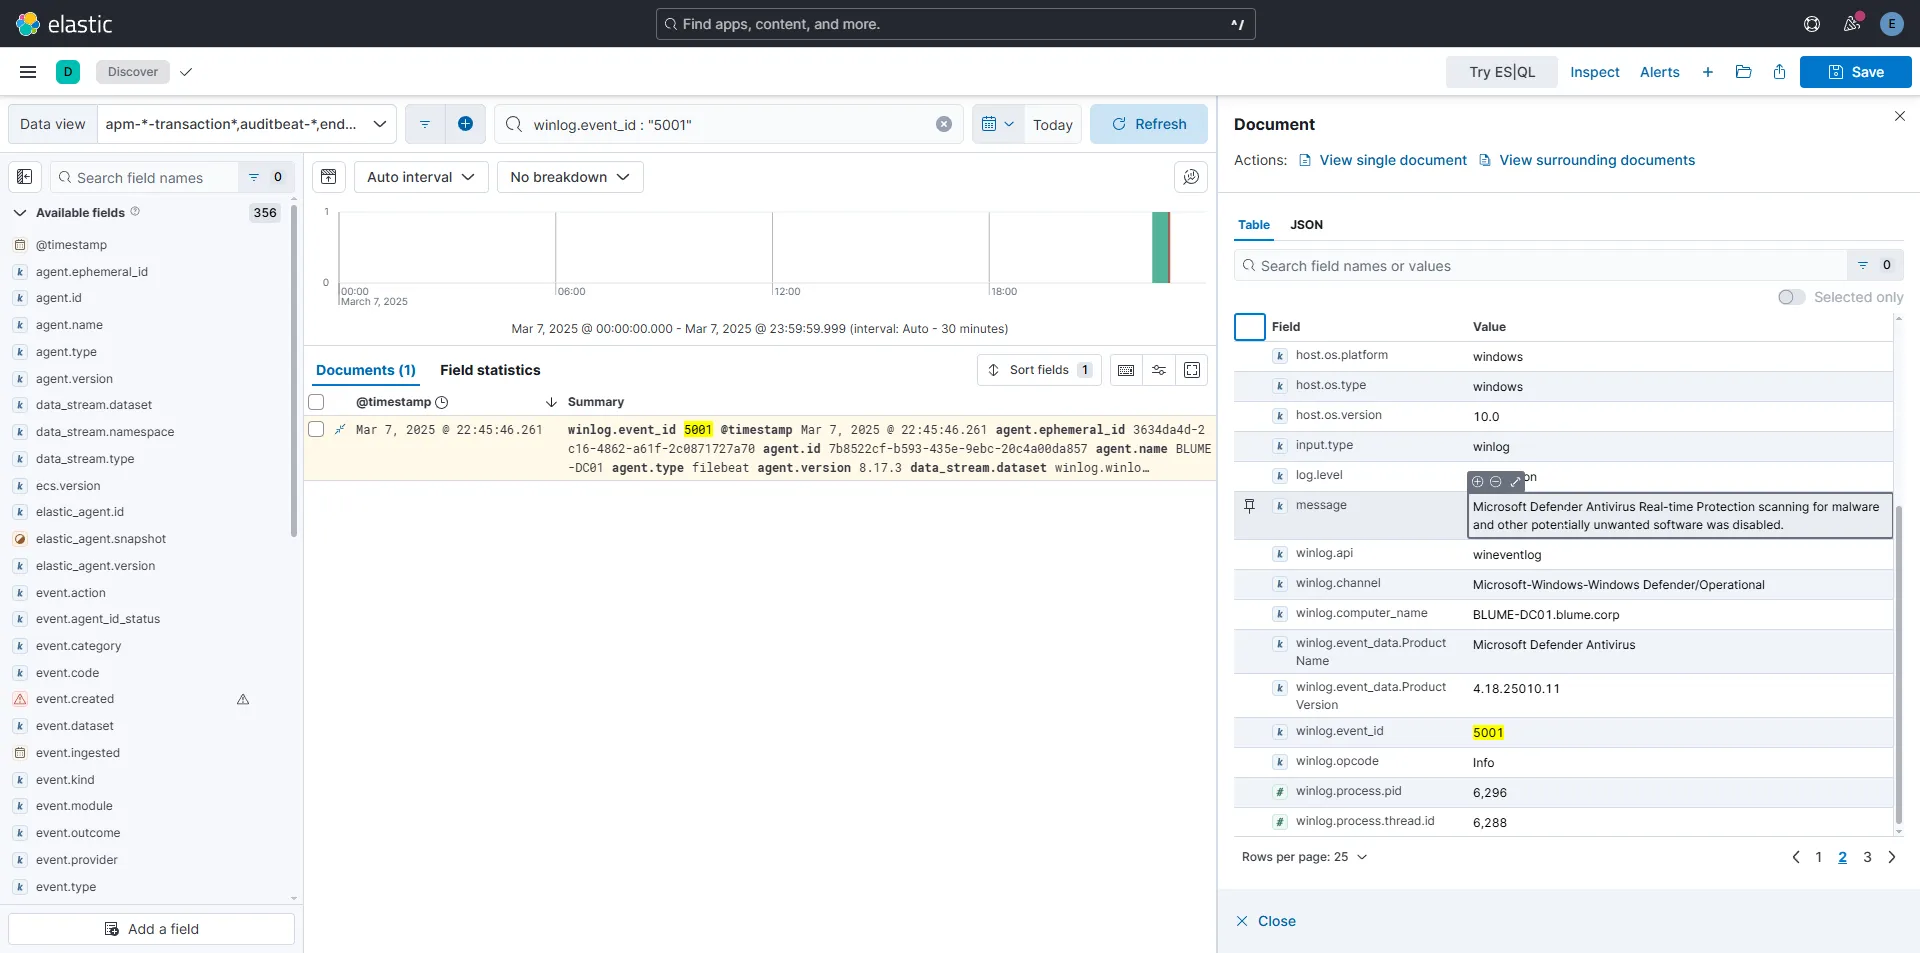
We can also see WinDefender logs as shown here. (I tried to disable Defender to trigger the relevant event).
Ubuntu Agent
Just like we did with Windows, we’ll now create a policy and set up an agent for an Ubuntu server to see how logs are handled from a Linux perspective.
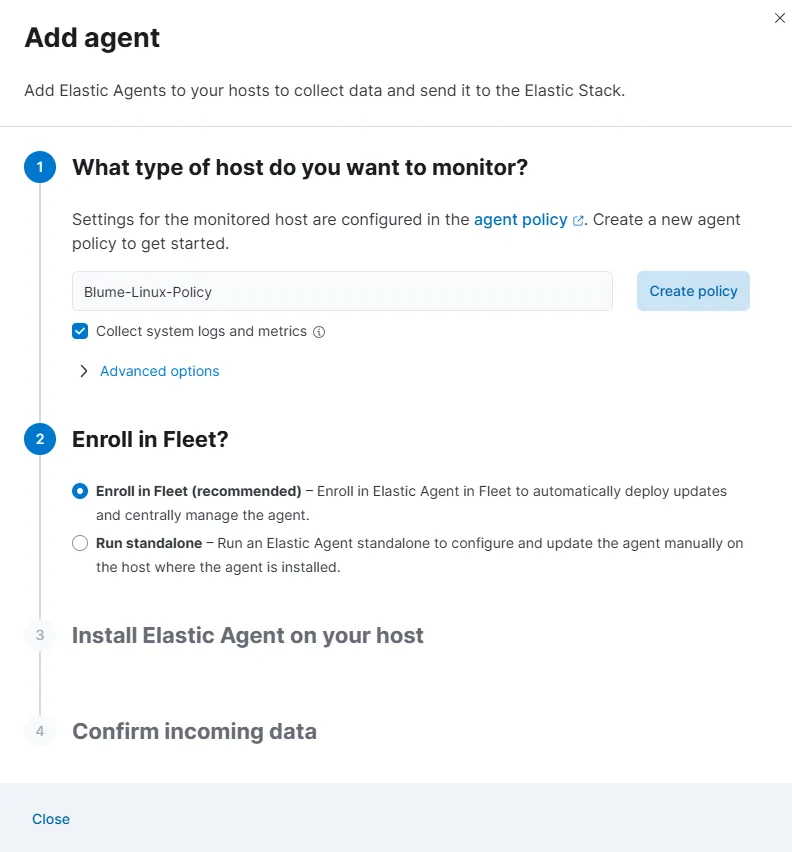
First, we create a policy of course.
Before continuing with the agent setup, let’s take a quick look at the policy we just created. By default, it includes a system integration, which means it will automatically log system authentication events and syslog messages.
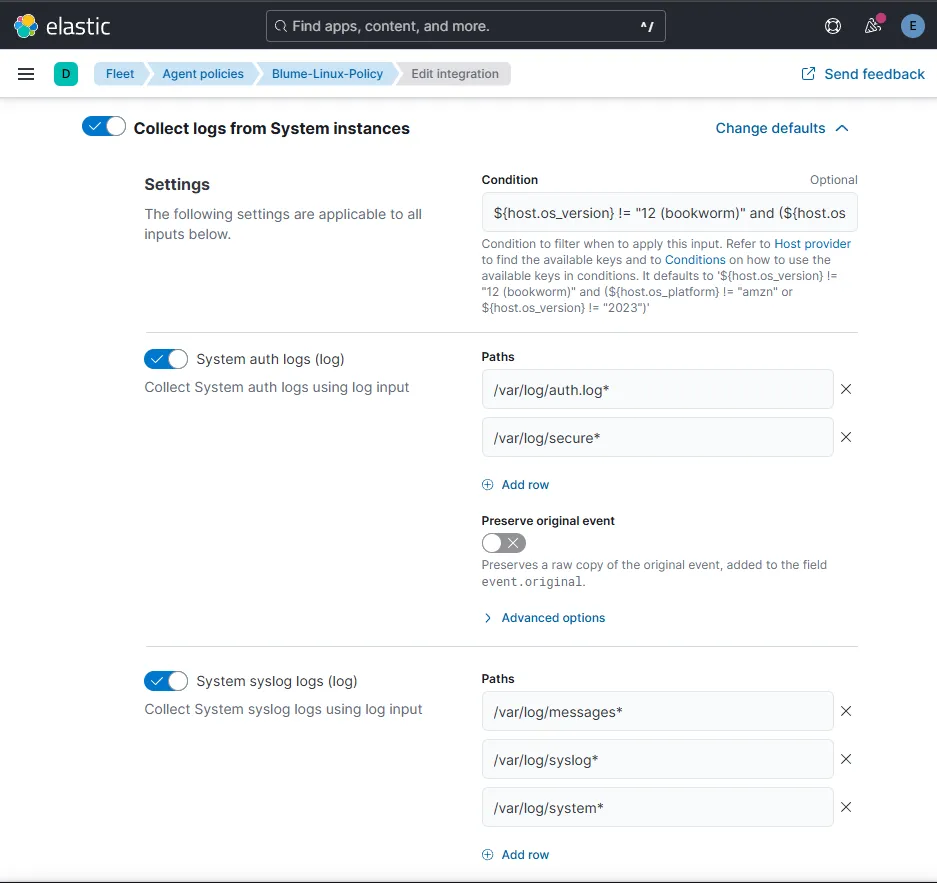
The authentication logs contain various login-related events, which will be more than enough for our initial setup. This will allow us to experiment with Elastic and even create some Kibana charts!
Now, onto the agent setup—nothing too fancy here.
We take the provided installation command and add --insecure to prevent SSL issues (of course, this is just for testing; in a production environment, we’d want proper SSL configuration).
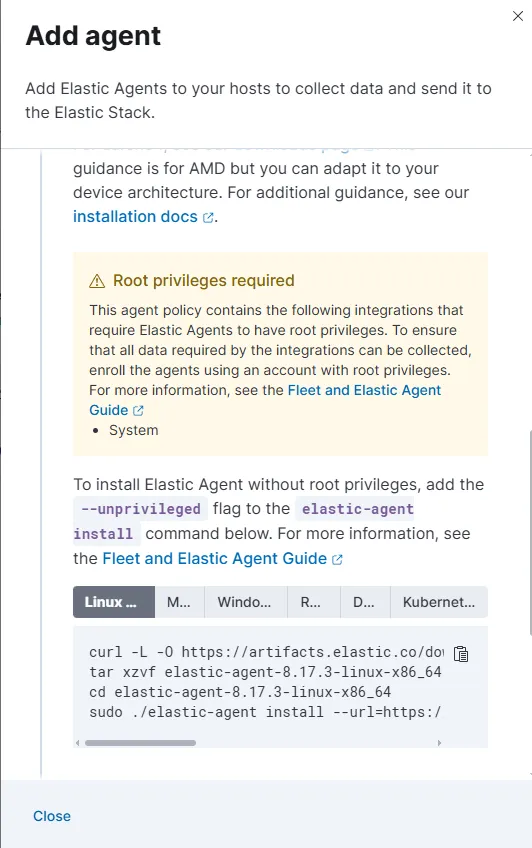
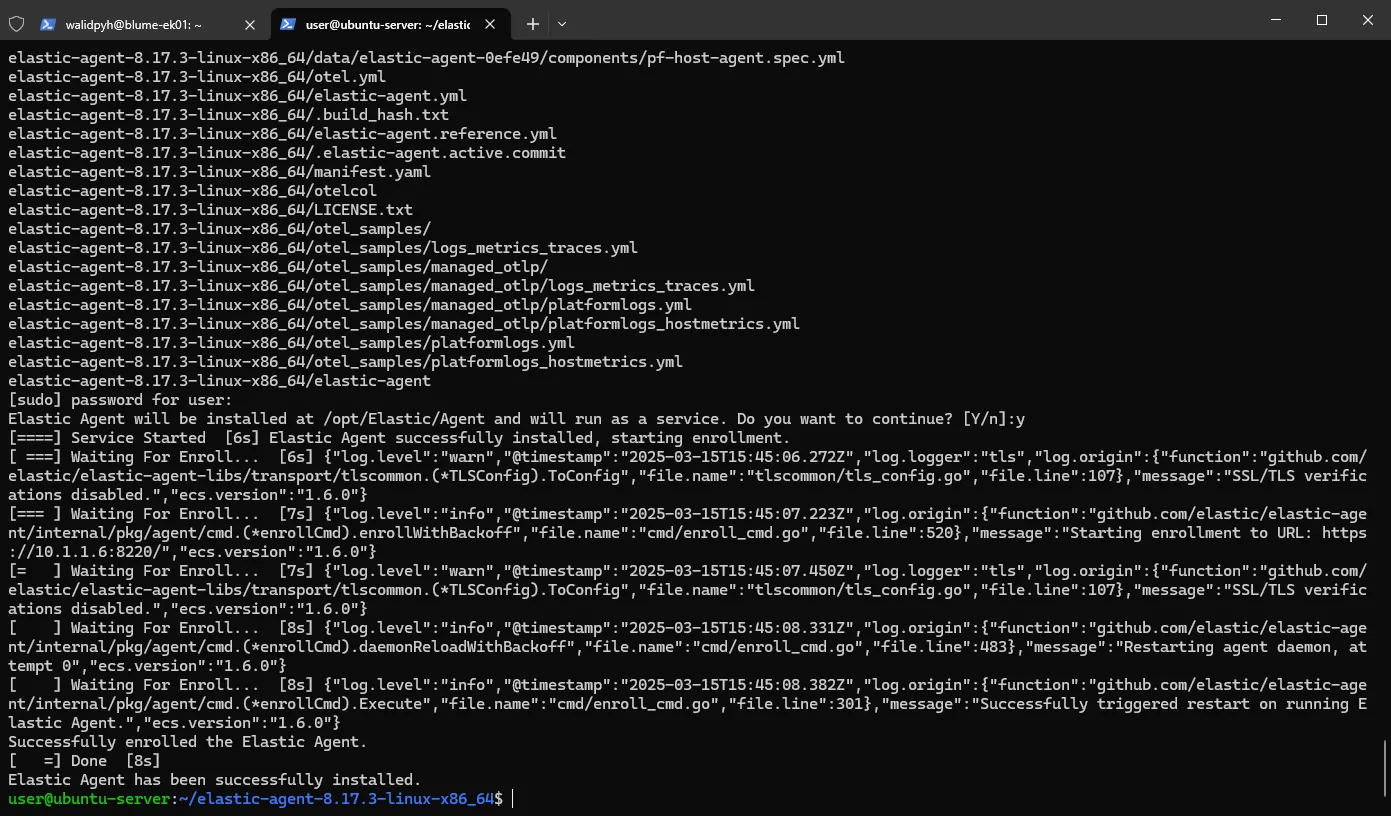
Once installed, the agent should be up and running!
Alerts
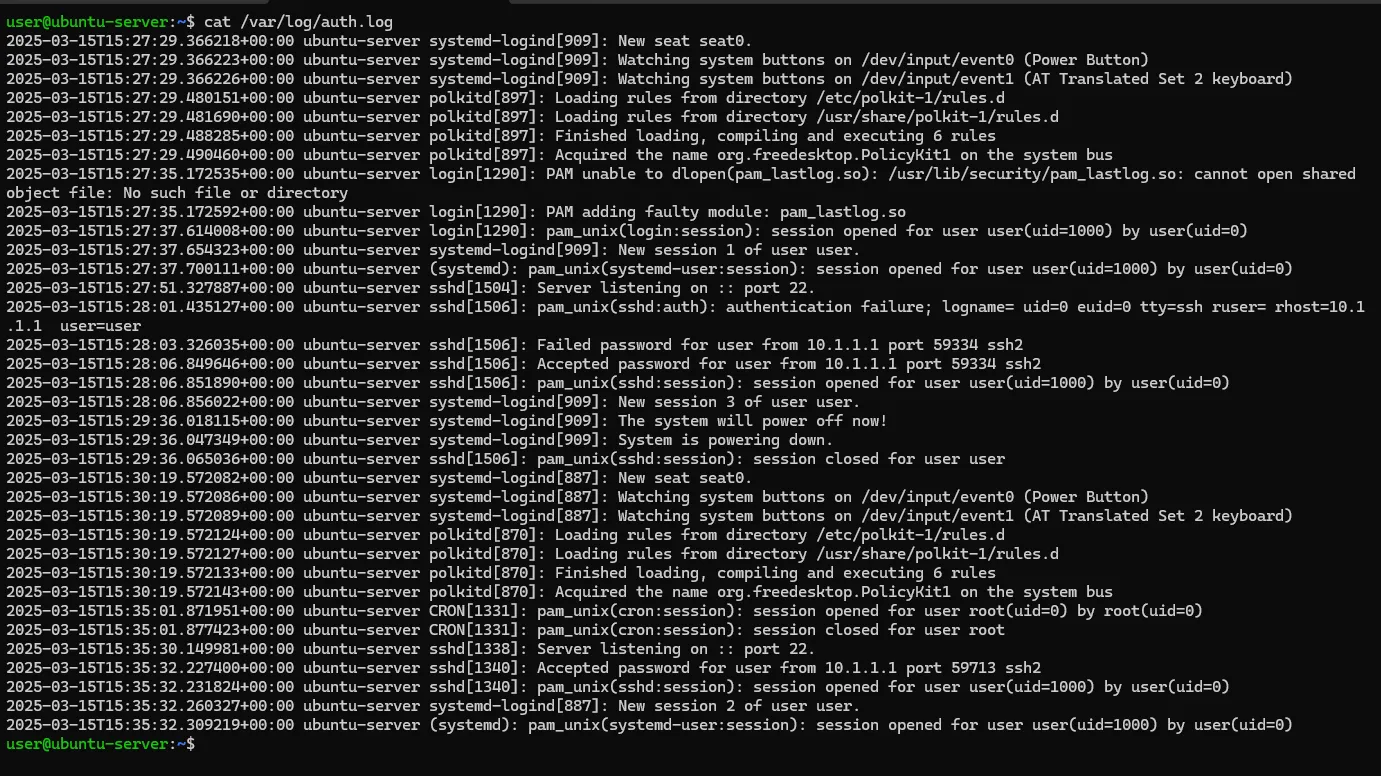
SSH BruteForce
When it comes to brute-force attacks, the main thing we want to look for in our logs is failed authentication attempts. Attackers typically try multiple login attempts until they find valid credentials. By monitoring failed SSH authentication logs, we can detect these types of attacks early.
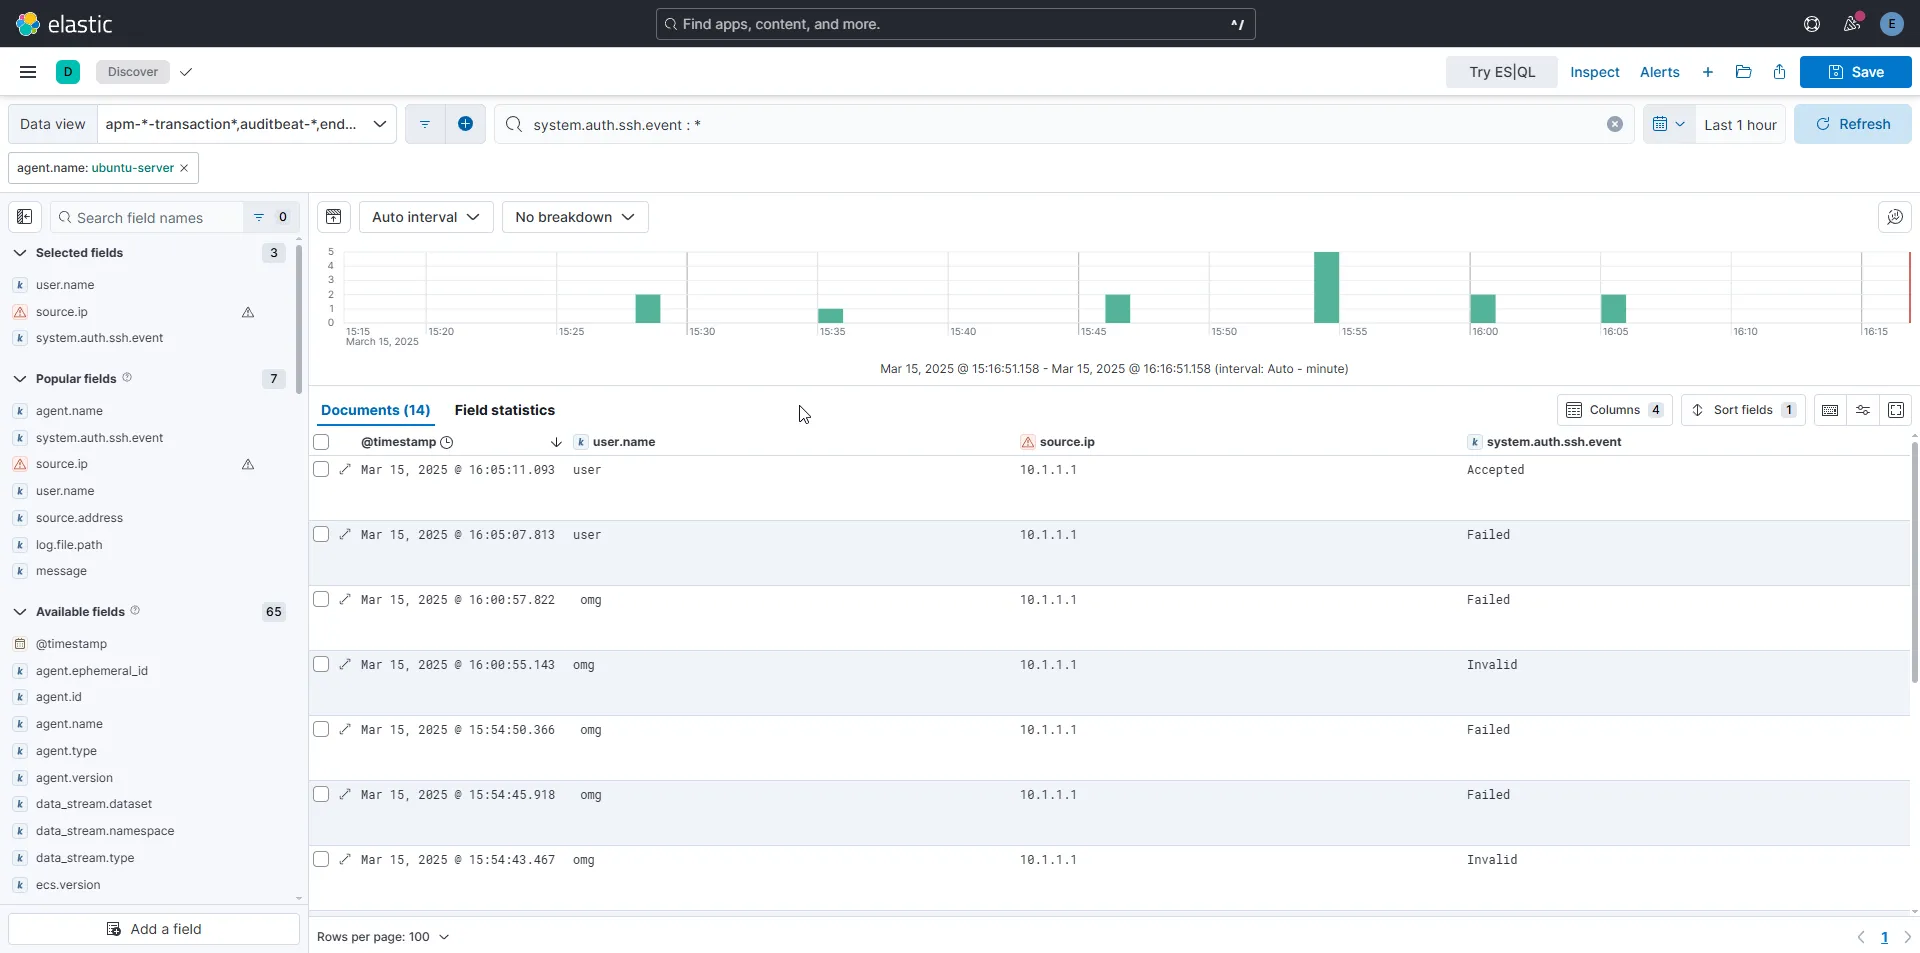
To start, we go to the Discovery section and filter logs based on our agent.name, which corresponds to our Ubuntu server. Since we’re focusing on SSH authentication, we also add a filter to check if system.auth.ssh.event exists: system.auth.ssh.event : *
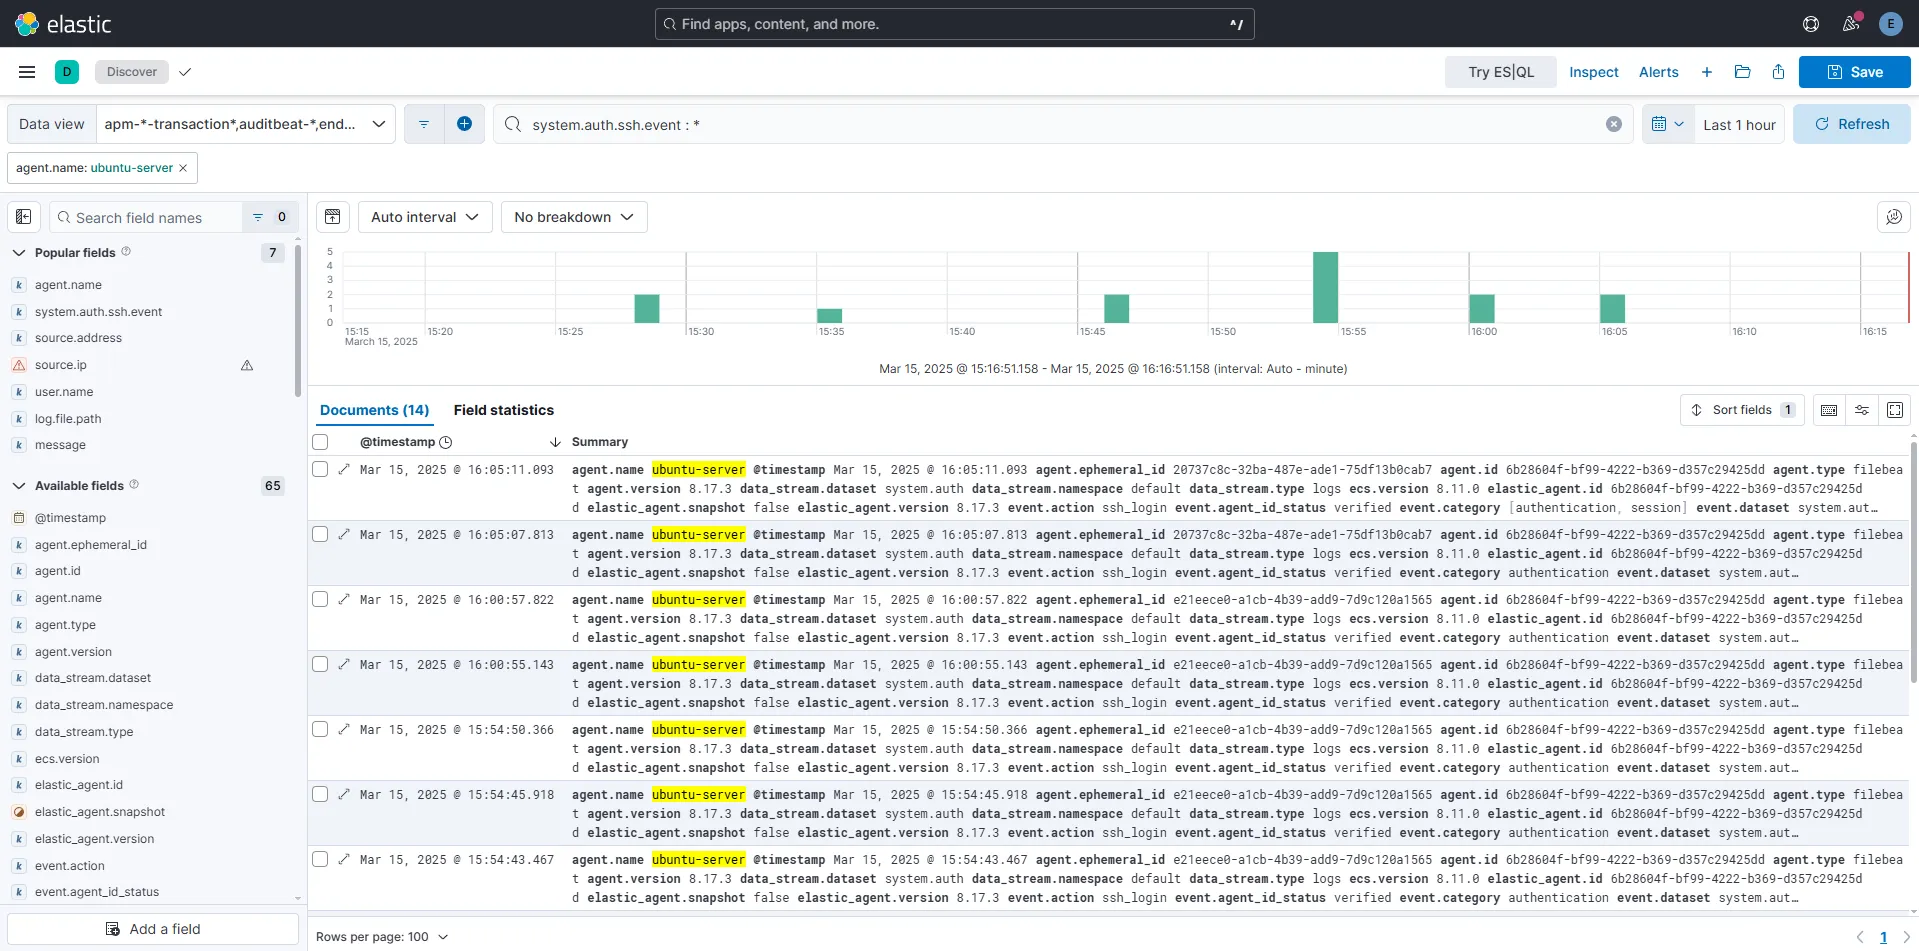
After running this query, we see around 14 log entries (I manually triggered some failed SSH attempts beforehand using both existing and non-existing usernames to populate the logs).
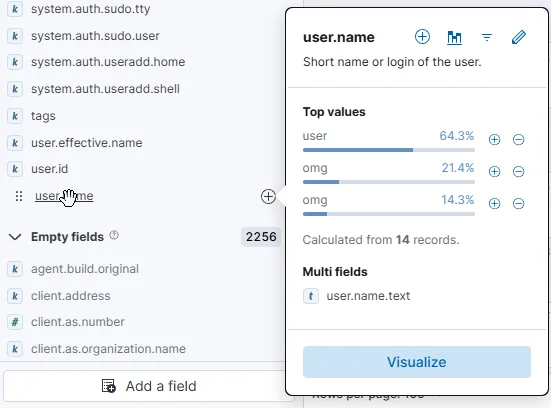
By inspecting the available fields, we find several useful ones for filtering and building a detailed table, including username, source.ip, and system.auth.ssh.event. In my case, everything was local, so I couldn’t use geo-location on the IP addresses. However, if you’re dealing with external traffic, you could use it to map where these attacks are coming from and even create a visual graph!
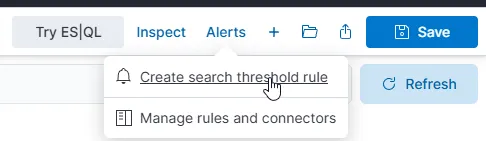
Now that we have a refined query, we can create an alert directly from it by clicking on the “Alerts” tab at the top.
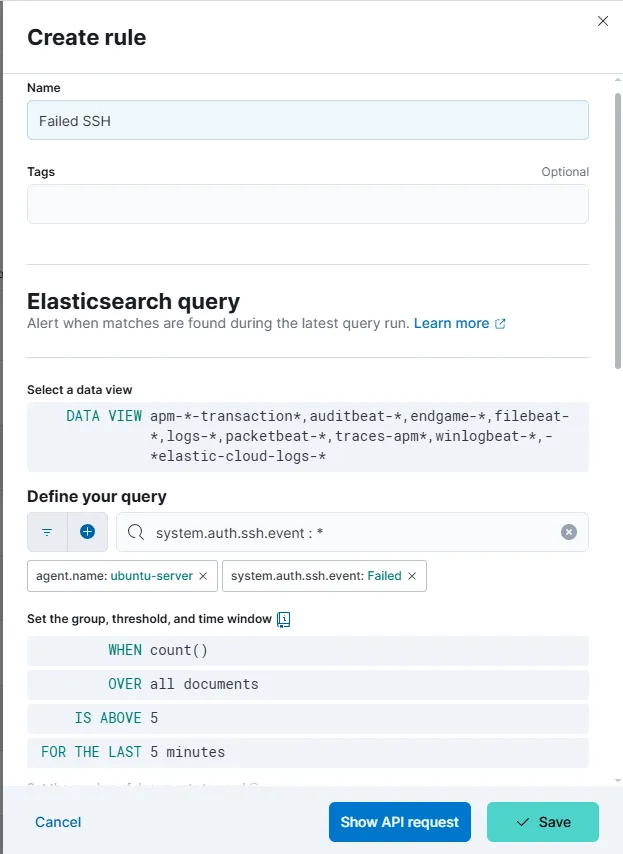
For this example, I set the alert to trigger if there are more than five failed authentication attempts within five minutes. Obviously, this isn’t a great threshold for real-world security, but it works well for testing purposes in our controlled environment.
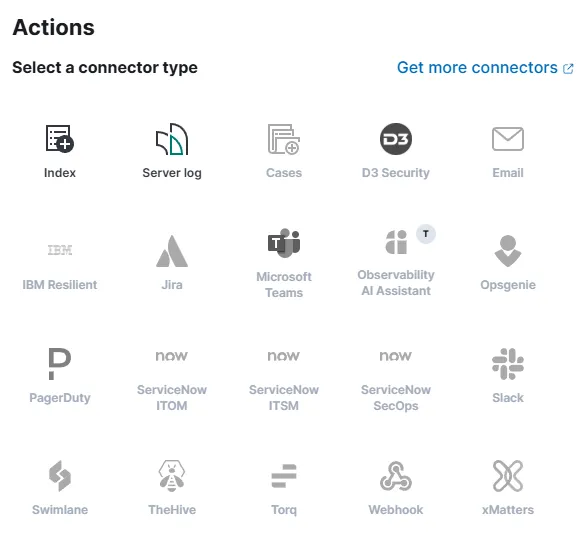
At this stage, we won’t configure any actions, but Elastic provides plenty of options if you need to monitor something critical. You can set alerts to automatically notify you via email, webhook, Slack, Microsoft Teams, and more!
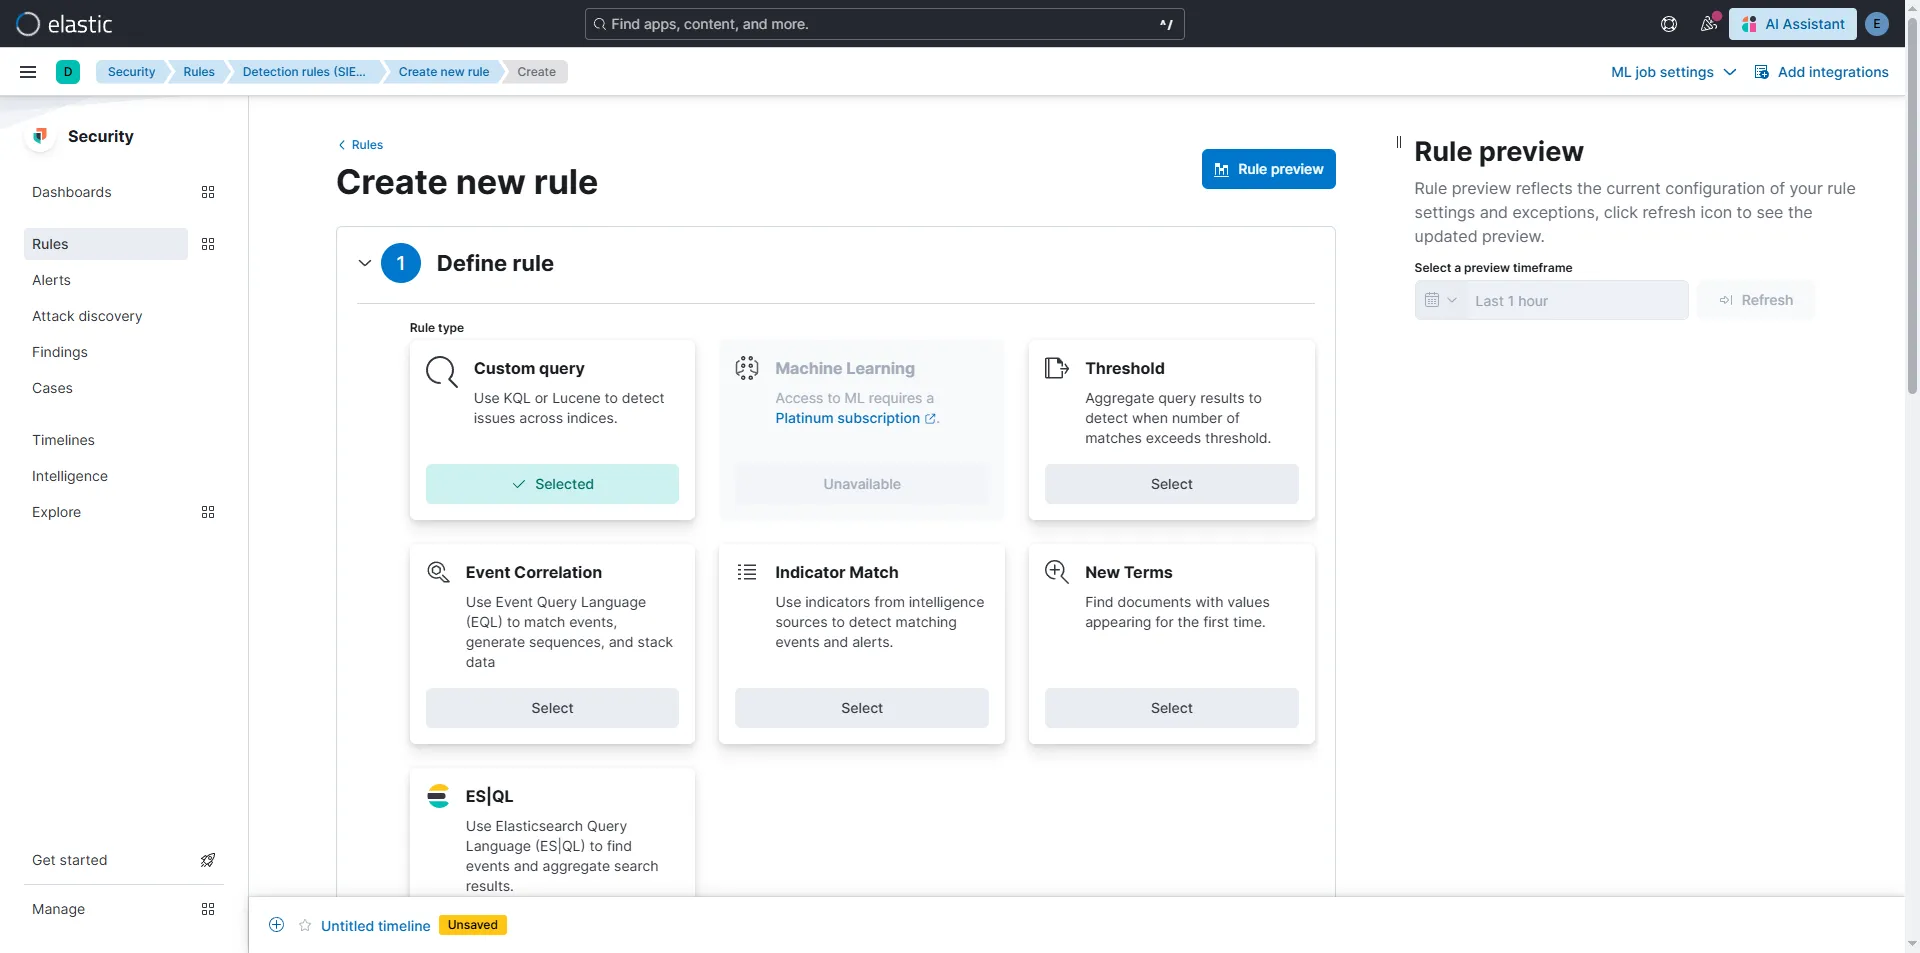
There is also another type of Alerts/Rules under Security section that is worth mentioning since it offers far more customization and details
Dashboards
When it comes to dashboards, the setup is pretty straightforward and depends on the type of data you want to visualize. You can experiment as much as you want!
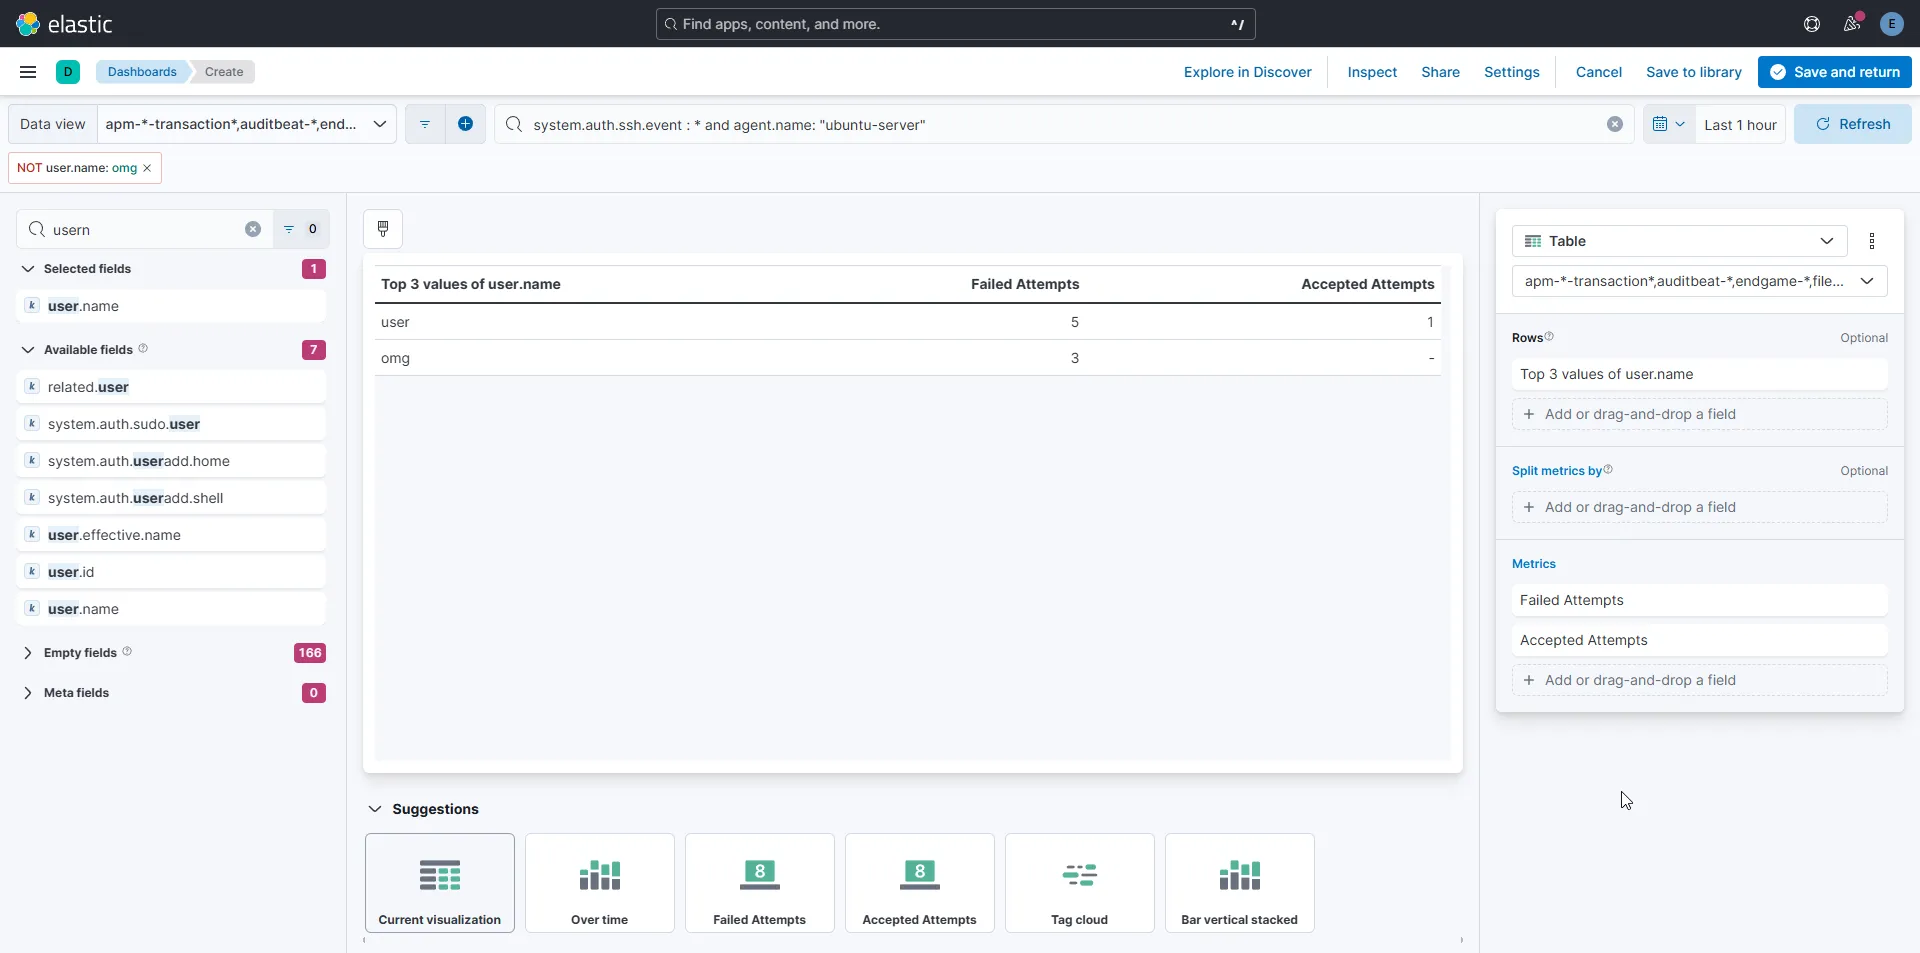
For example, here’s a simple table that shows usernames along with the number of failed and successful login attempts:
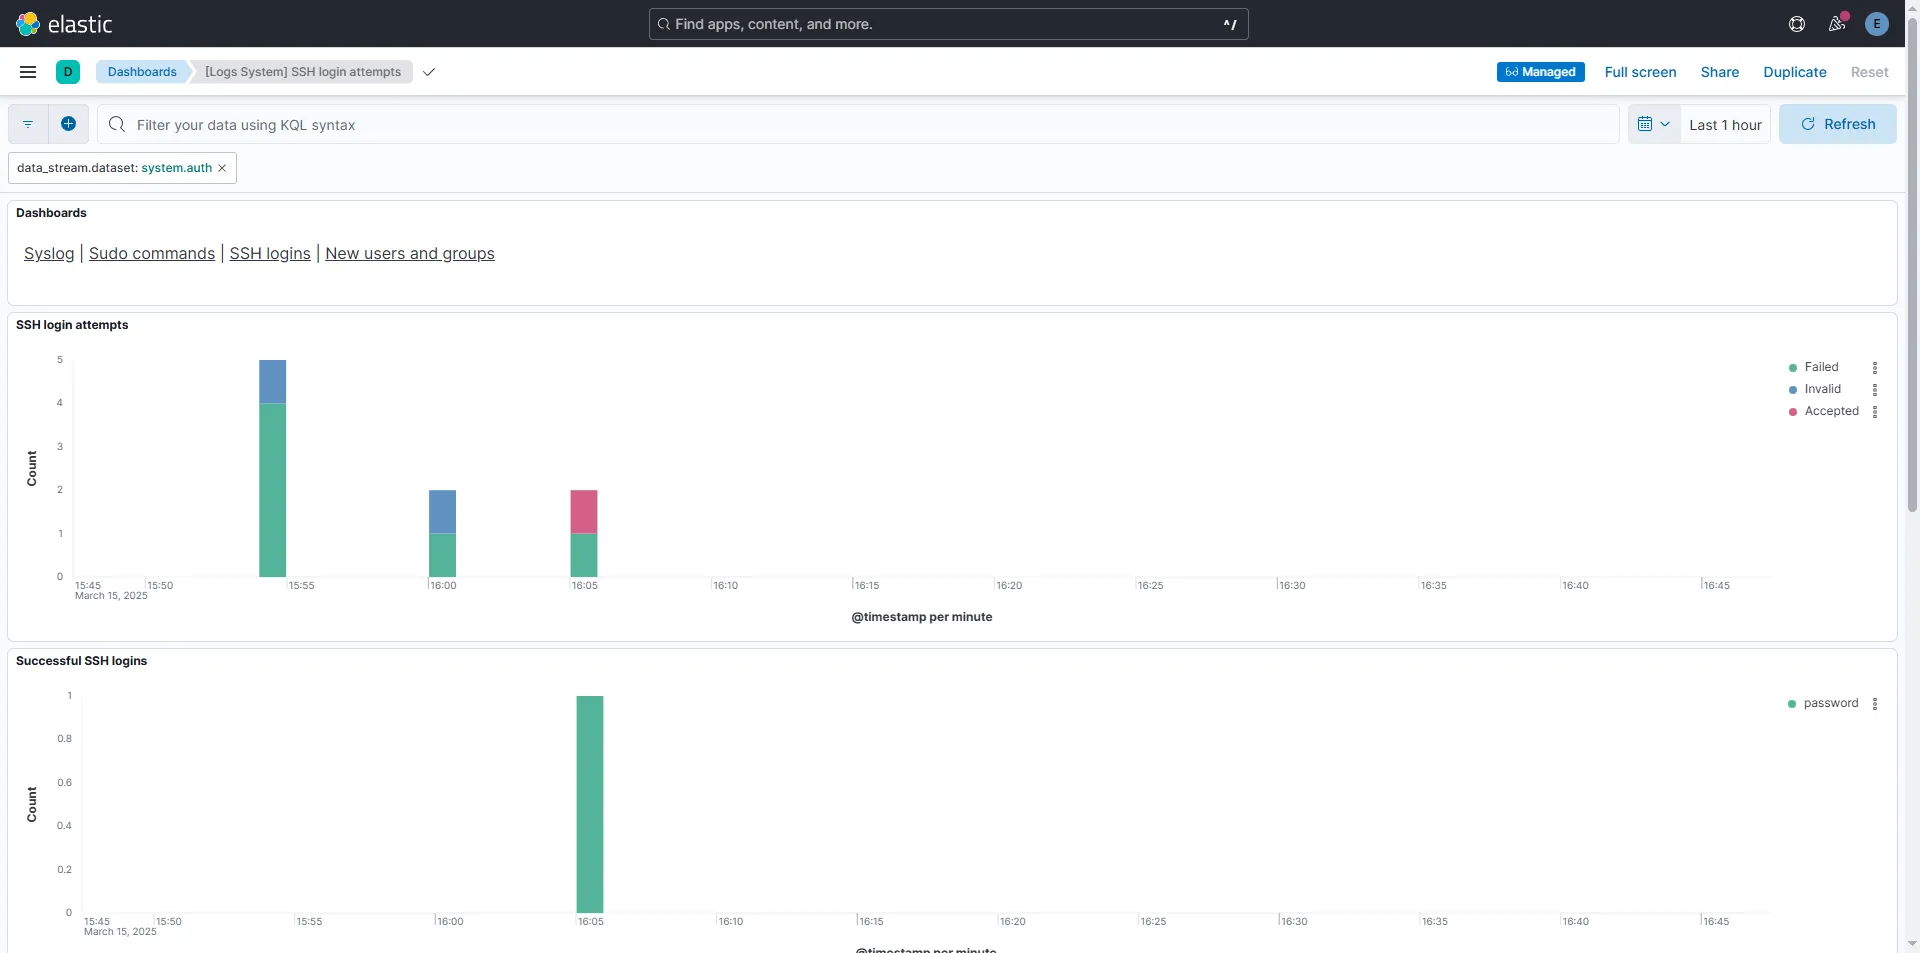
Or, if you’re feeling lazy (like me), you can grab a pre-made dashboard template and customize it to fit your needs. Here’s an example using [Logs System] SSH login attempts:
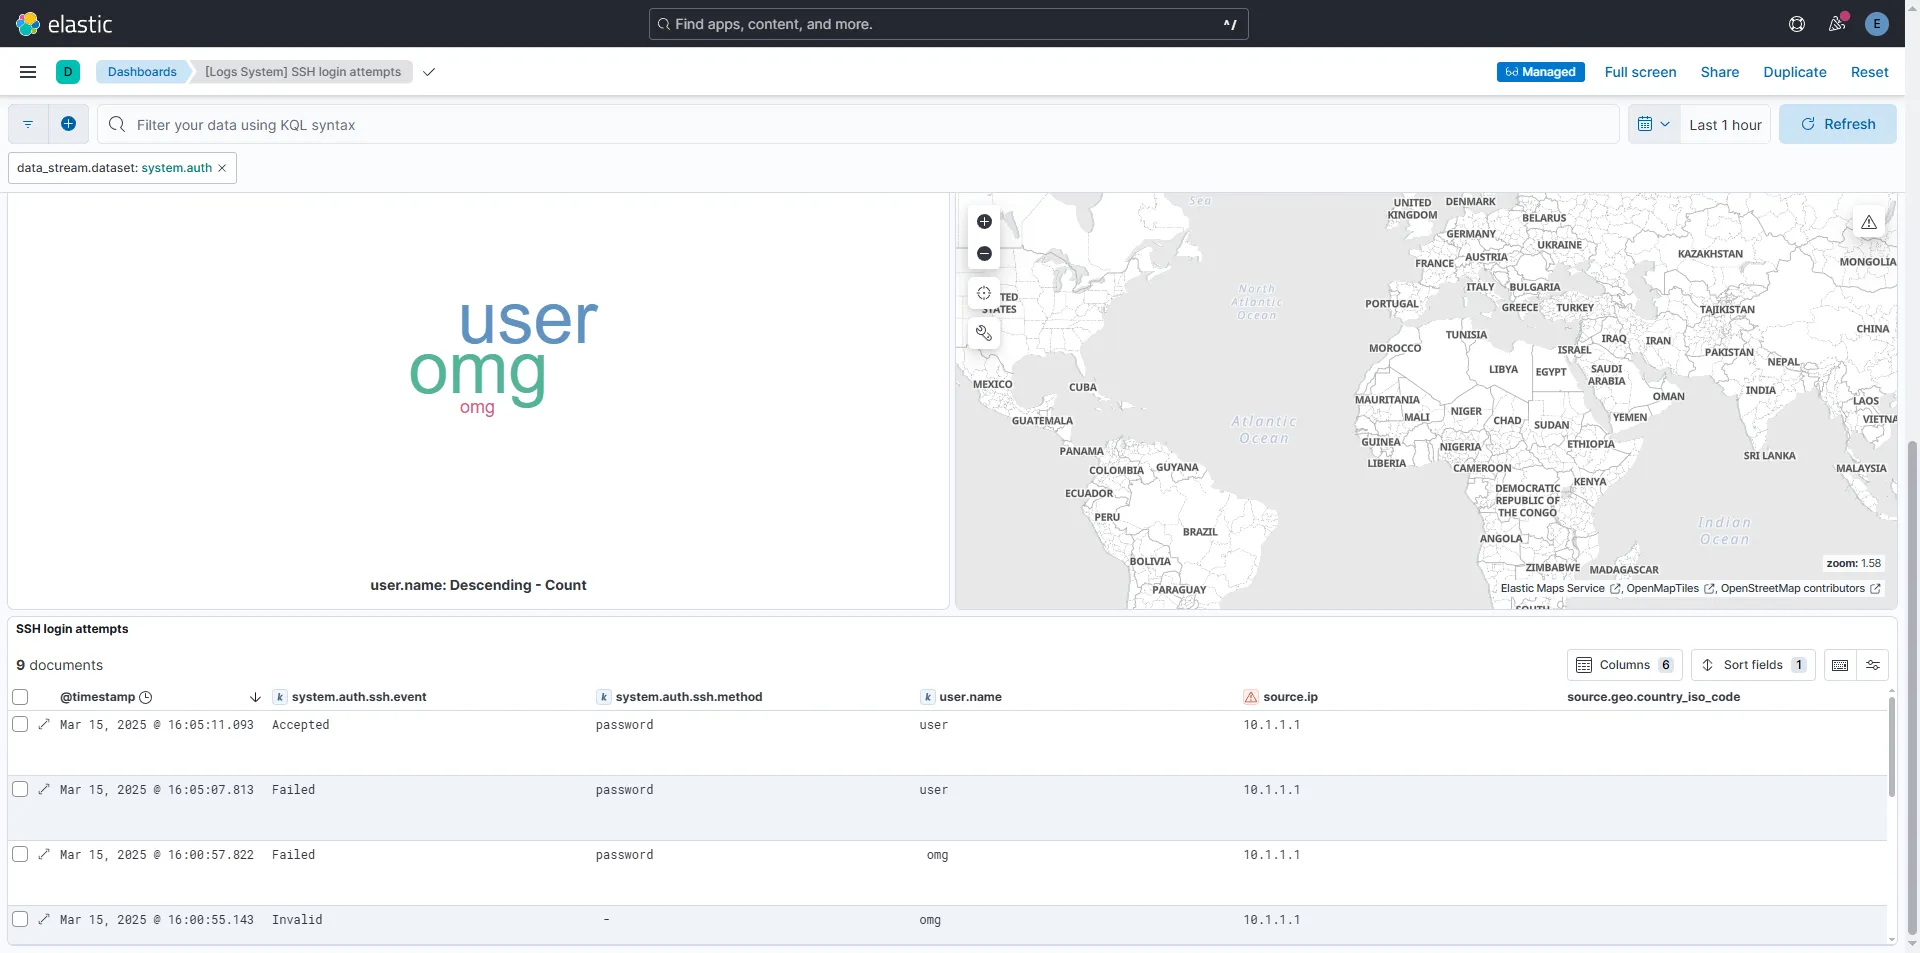
This same approach can be applied to a wide range of events. You could create one dashboard for monitoring critical Linux logs, another for tracking Windows events, and others for services like Remote Desktop, SMB, or any other logs that matter to you!